Correlations
Compute all pairwise attribute correlations.
Inputs
Data: input dataset
Outputs
Data: input dataset
Features: selected pair of features
Correlations: data table with correlation scores
Correlations computes Pearson or Spearman correlation scores for all pairs of features in a dataset. These methods can only detect monotonic relationship.
 {width=400px}
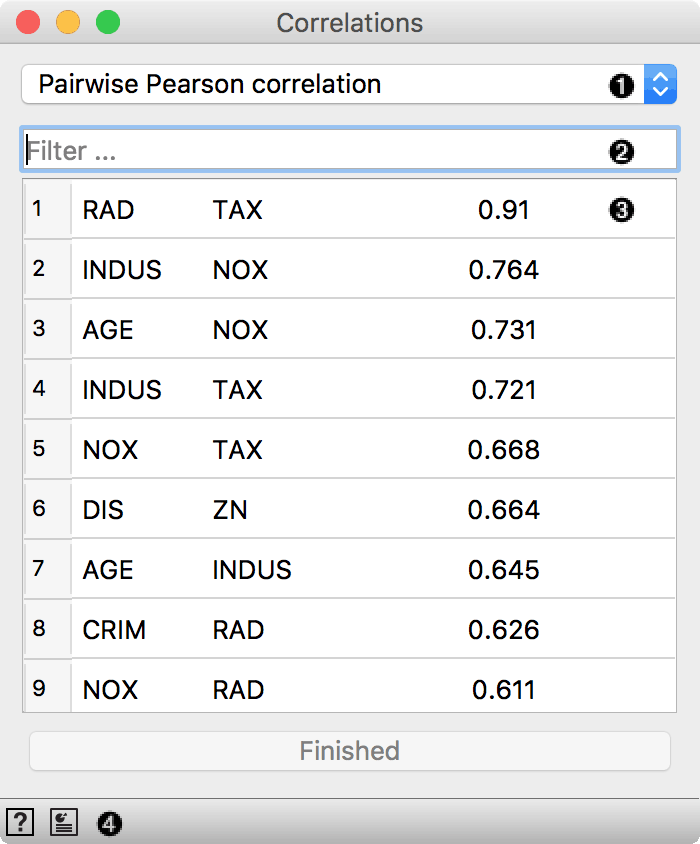
Correlation measure:
Select the attribute for computing correlations. Useful for large datasets.
Filter for finding attribute pairs.
Press Finished to stop computation for large datasets.
Example
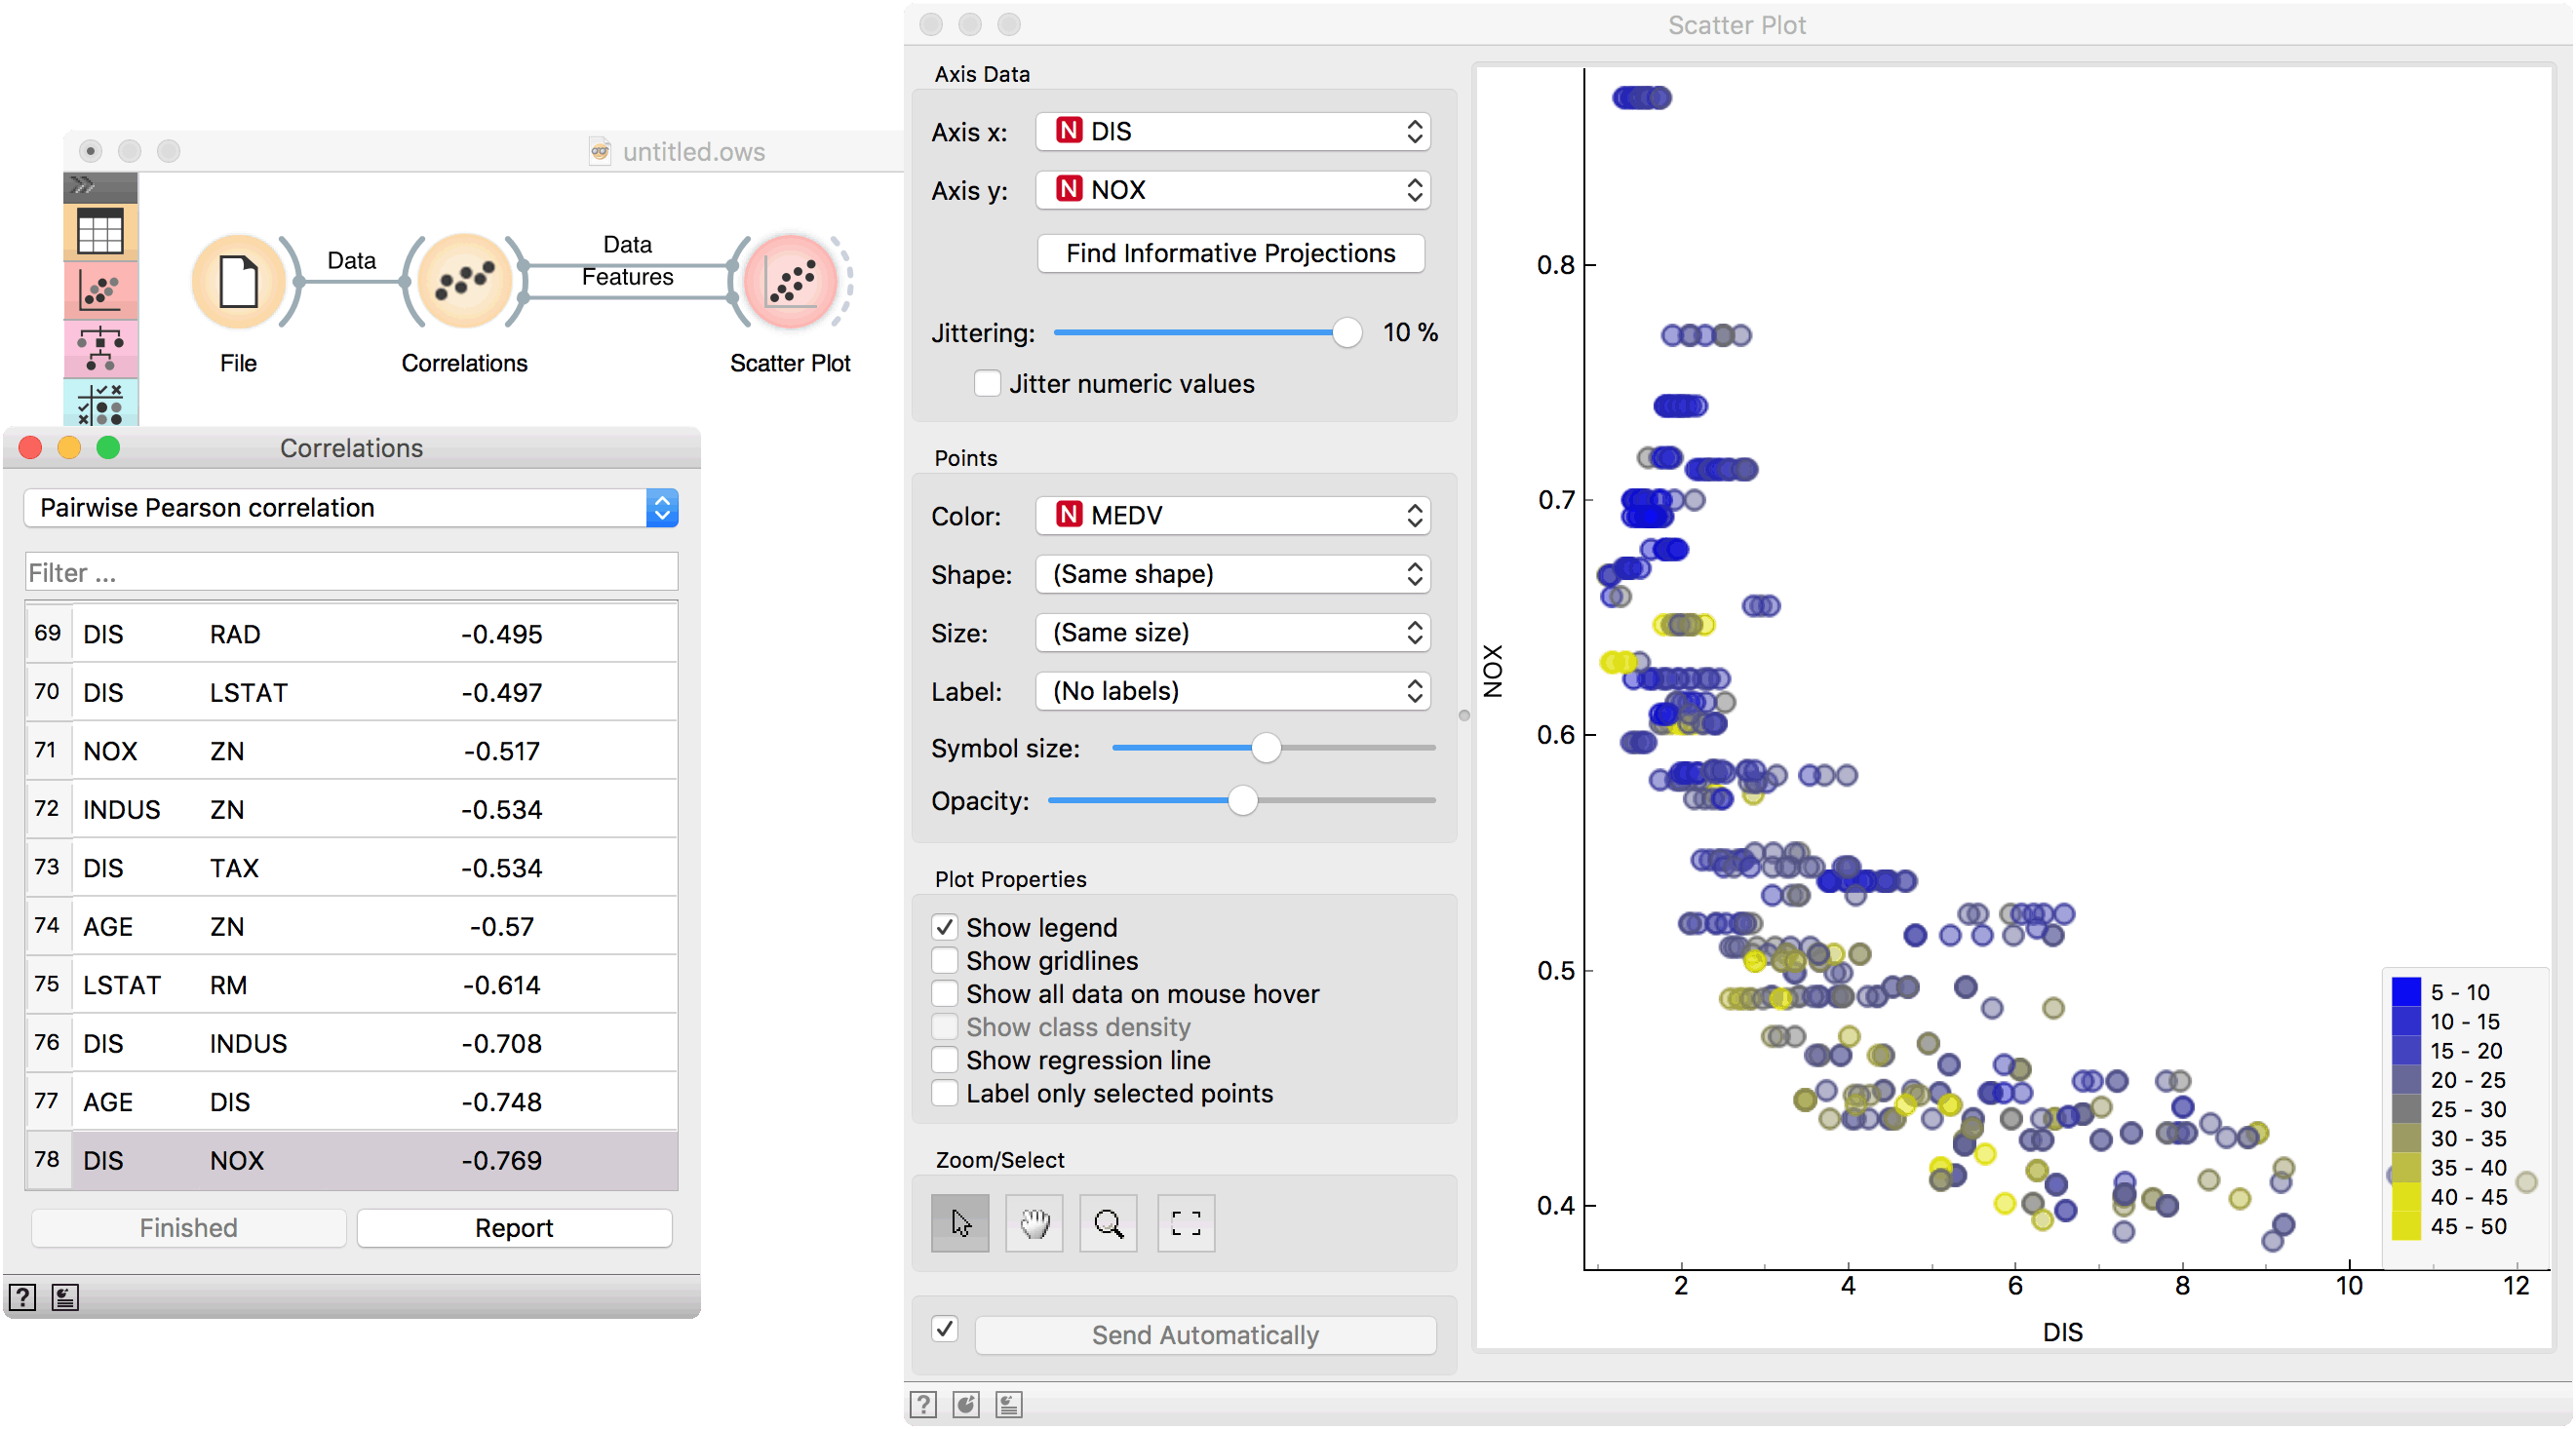
Correlations can be computed only for numeric (continuous) features, so we will use brown-selected as an example data set. Load it in the File widget and connect it to Correlations. Positively correlated feature pairs will be at the top of the list and negatively correlated will be at the bottom.
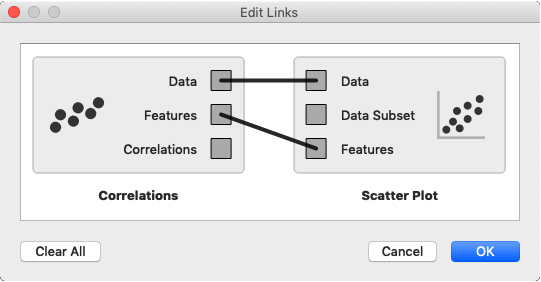
Select the most correlated feature pair. Now connect Scatter Plot to Correlations and set two outputs, Data to Data and Features to Features. Observe how the feature pair is immediately set in the scatter plot. Looks like the two features are indeed positively correlated.