Linear Projection

A linear projection method with explorative data analysis.
Signals
Inputs:
Data
An input data set
Data Subset
A subset of data instances
Outputs:
Selected Data
A data subset that the user has manually selected in the projection.
Description
This widget displays linear projections of class-labeled data. Consider, for a start, a projection of the Iris data set shown below. Notice that it is the sepal width and sepal length that already separate Iris setosa from the other two, while the petal length is the attribute best separating Iris versicolor from Iris virginica.
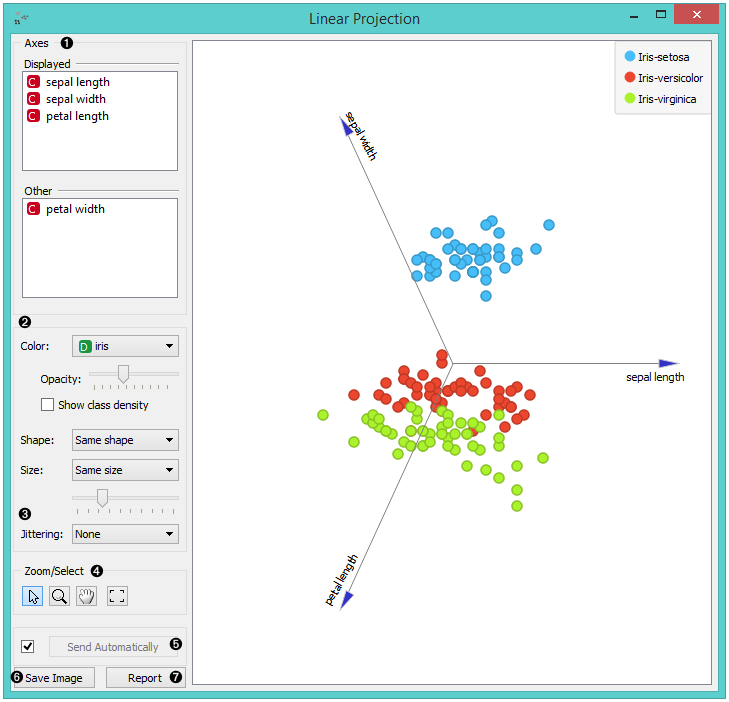
- Axes in the projection that are displayed and other available axes.
- Set the color of the displayed dots (you will get colored dots for discrete values and grey-scale dots for continuous). Set opacity, shape and size to differentiate between instances.
- Set jittering to prevent the dots from overlapping (especially for discrete attributes).
- Select, zoom, pan and zoom to fit options for exploring the graph. Manual selection of data instances works as a non-angular/free-hand selection tool. Double click to move the projection. Scroll in or out for zoom.
- When the box is ticked (Auto commit is on), the widget will communicate the changes automatically. Alternatively, click Commit.
- Save Image saves the created image to your computer in a .svg or .png format.
- Produce a report.
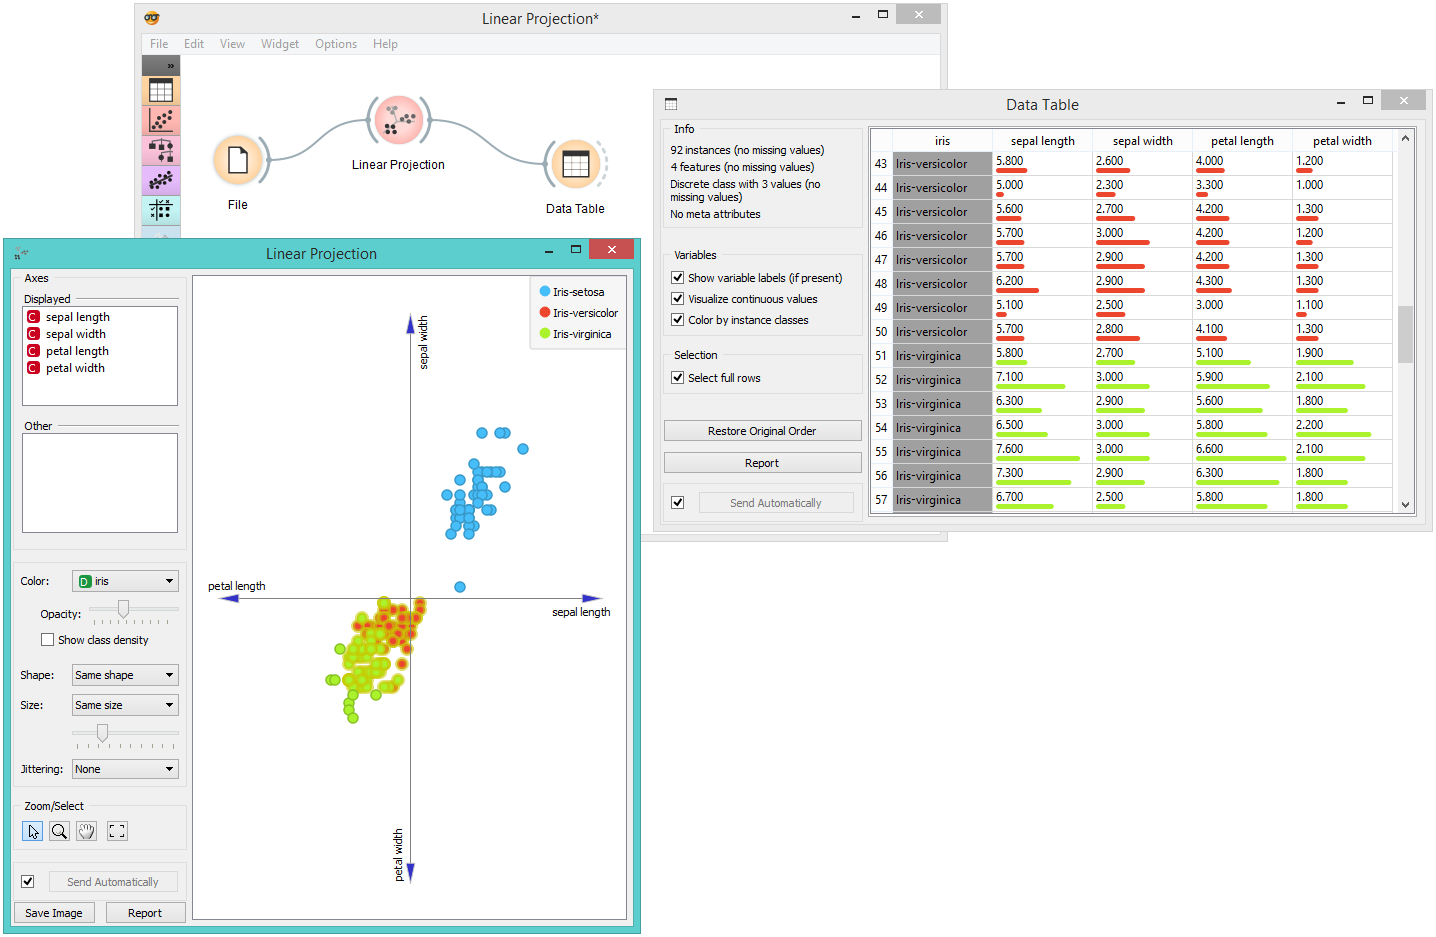
Example
The Linear Projection widget works just like other visualization widgets. Below, we connected it to the File widget to see the set projected on a 2-D plane. Then we selected the data for further analysis and connected it to the Data Table widget to see the details of the selected subset.
References
Koren Y., Carmel L. (2003). Visualization of labeled data using linear transformations. In Proceedings of IEEE Information Visualization 2003, (InfoVis‘03). Available here.
Boulesteix A.-L., Strimmer K. (2006). Partial least squares: a versatile tool for the analysis of high-dimensional genomic data. Briefings in Bioinformatics, 8(1), 32-44. Abstract here.