Box Plot

Shows distribution of attribute values.
Description
The Box Plot widget shows the distributions of attribute values. It is a good practice to check any new data with this widget to quickly discover any anomalies, such as duplicated values (e.g. gray and grey), outliers, and alike.
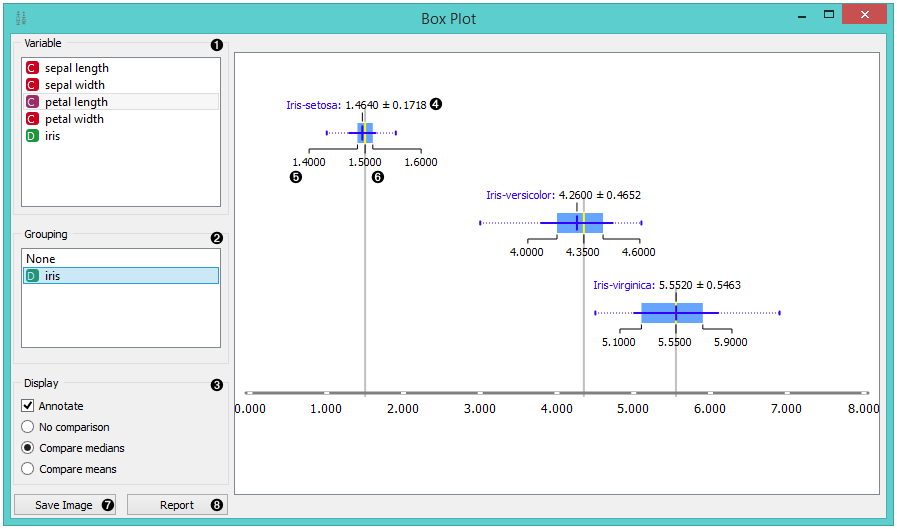
- Select the variable you want to see plotted.
- Choose Grouping to see box plots displayed by class.
- When instances are grouped by class, you can change the display mode. Annotated boxes will display the end values, the mean and the median, while compare medians and compare means will, naturally, compare the selected value between class groups.
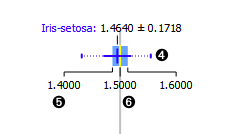
For continuous attributes the widget displays:
- The mean (the dark blue vertical line)
- Border values for the standard deviation of the mean. The blue highlighted area is the entire standard deviation of the mean.
- The median (yellow vertical line). The thin blue line represents the area between the first (25%) and the third (75%) quantile, while the thin dotted line represents the entire range of values (from the lowest to the highest value in the data set for the selected parameter).
- Save image.
- Produce a report.
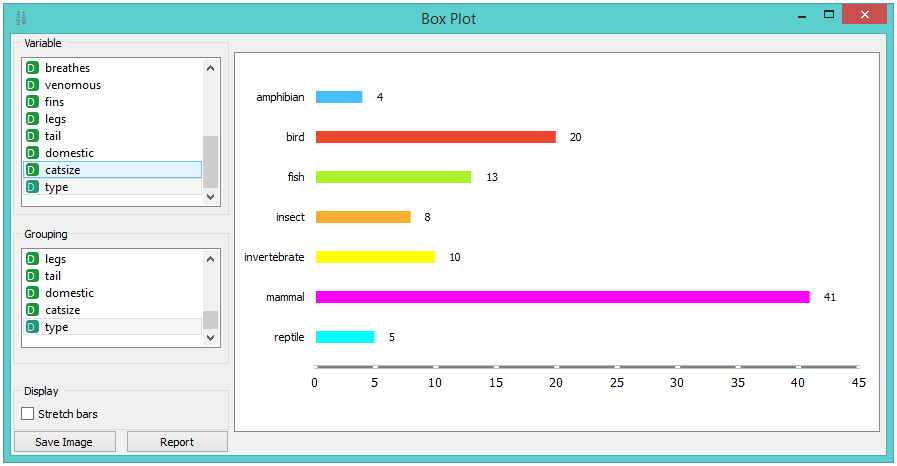
For discrete attributes, the bars represent the number of instances with each particular attribute value. The plot shows the number of different animal types in the Zoo data set: there are 41 mammals, 13 fish, 20 birds and so on.
Example
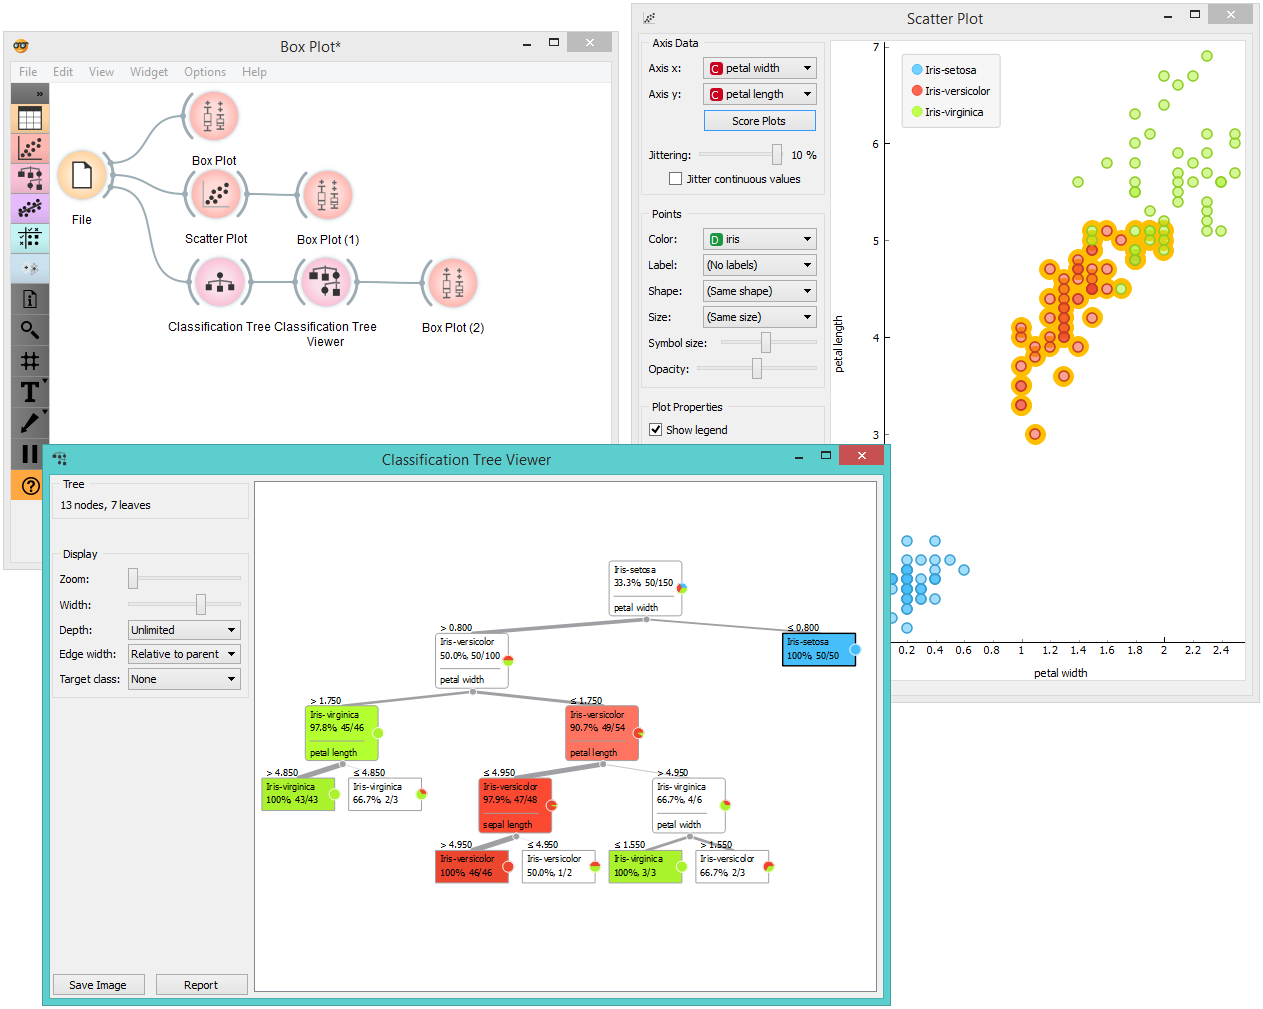
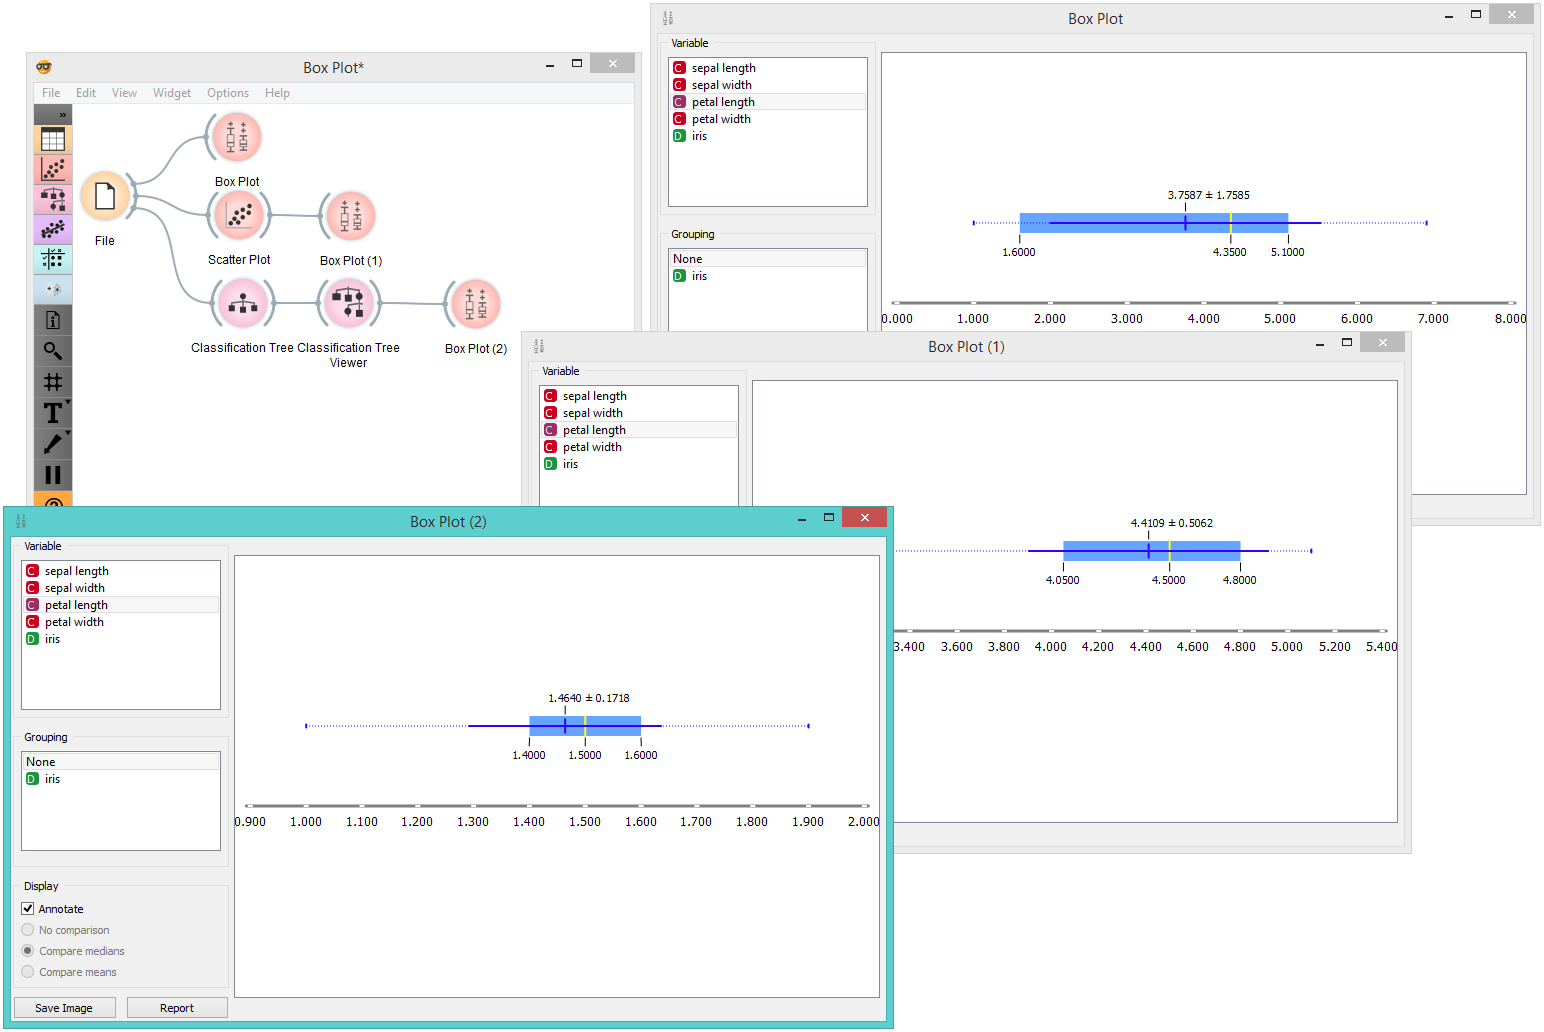
The Box Plot widget is most commonly used immediately after the File widget to observe the statistical properties of a data set. It is also useful for finding the properties of a specific data set, for instance a set of instances manually defined in another widget (e.g. Scatterplot) or instances belonging to some cluster or a classification tree node, as shown in the schema below.