Stochastic Gradient Descent

Learns a linear classifier by minimizing a chosen loss function.
Signals
Inputs:
Data
A data set.
Preprocessor
Preprocessed data.
Outputs:
Learner
A learning algorithm with supplied parameters
Predictor
A trained regressor. Signal Predictor sends the output signal only if input Data is present.
Description
The Stochastic Gradient Descent widget uses stochastic gradient descent that minimizes a chosen loss function with a linear function. The algorithm approximates a true gradient by considering one sample at a time, and simultaneously updates the model based on the gradient of the loss function. This regression returns predictors as minimizers of the sum, i.e. M-estimators, and is especially useful for large-scale and sparse data sets.
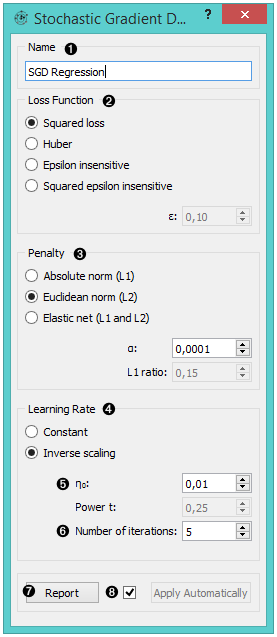
- Learner/predictor name
- Loss functions:
- Squared Loss (fitted to ordinary least-squares)
- Huber (switches to linear loss beyond ε)
- Epsilon insensitive (ignores errors within ε, linear beyond it)
- Squared epsilon insensitive (loss is squared beyond ε-region).
- Regularization norms to prevent overfitting:
- Absolute norm (L1, leading to sparse solutions)
- Euclidean norm (L2, standard regularizer)
- Elastic net (mixing both penalty norms).
- Use the default Inverse scaling for the learning rate to be inversely related to the number of iterations or select Constant for LR to stay the same through all epochs (passes).
- Set the constants for the regression algorithm:
- Eta0: initial learning rate
- Power t: exponent for inverse scaling learning rate; t is time step 6, which relates to the number of passes through the training data.
- Produce a report.
- Press Apply to commit changes. Alternatively, tick the box on the left side of the Apply button and changes will be communicated automatically.
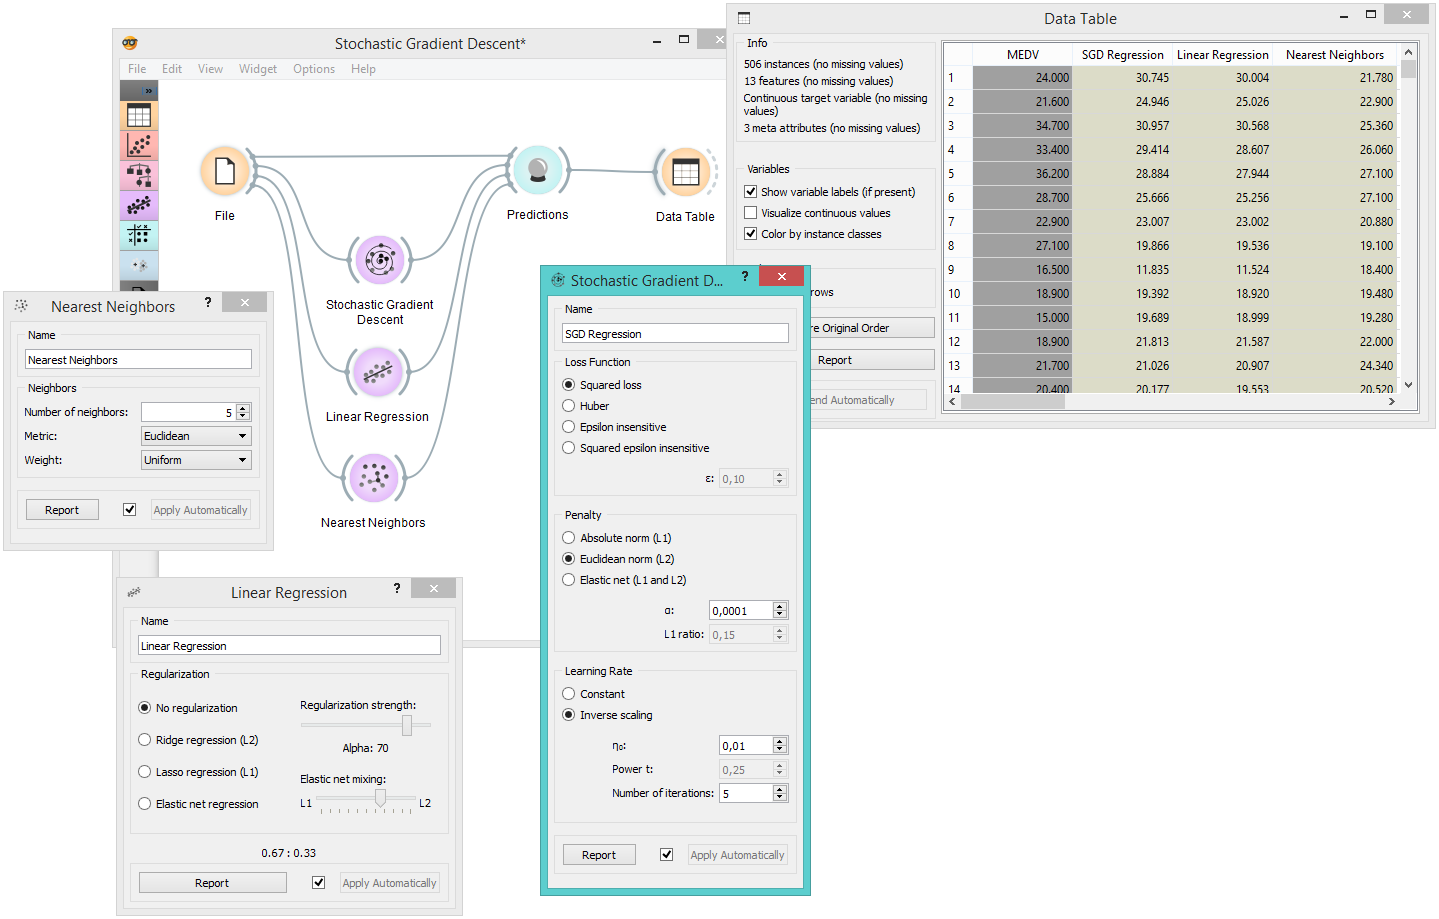
Example
Below, we compare three different regression models to see which predict what kind of results. For the purpose of this example, the Housing data set is used. We connect the File widget to Stochastic Gradient Descent, Linear Regression and Nearest Neighbors widget and all four to the Predictions widget. Then we use the Data Table to see what predictions each model makes.