SVM Regression

Learns a SVM regression of its input data.
Signals
Inputs:
Data
A data set.
Preprocessor
Preprocessed data.
Outputs:
Learner
A SVM learning algorithm with supplied parameters.
Predictor
A trained regressor. Signal Predictor sends the regressor only if signal Data is present.
Description
SVM Regression performs linear regression in a high dimension feature space using an ε-intensive loss. Its estimation accuracy depends on a good setting of C, ε and kernel parameters. The widget outputs class predictions based on a SVM learning algorithm.
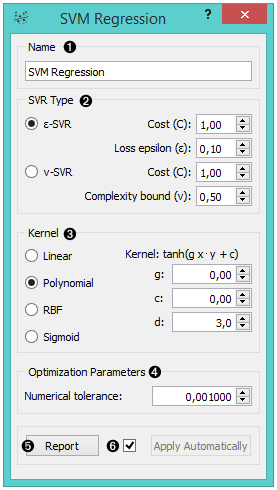
- Learner/predictor name
- Train an ε-SVR or v-SVR model and set test error bounds.
- Set kernel, a function that transforms attribute space to a new
feature space to fit the maximum-margin hyperplane, thus allowing the
algorithm to create non-linear regressors. The first kernel in the
list, however, is a
Linear kernel that
does not require this trick, but all the others
(Polynomial,
RBF
and
Sigmoid)
do.
Functions that specify the kernel are presented beside their
names, and the constants involved are:
- g for the gamma constant in kernel function (the recommended value is 1/k, where k is the number of the attributes, but since there may be no training set given to the widget the default is 0 and the user has to set this option manually),
- c for the constant c0 in the kernel function (default 0), and
- d for the degree of the kernel (default 3).
- Set permitted deviation from the expected value.
- Produce a report.
- Press Apply to commit changes. Alternatively, tick the box on the left side of the Apply button to communicate changes automatically.
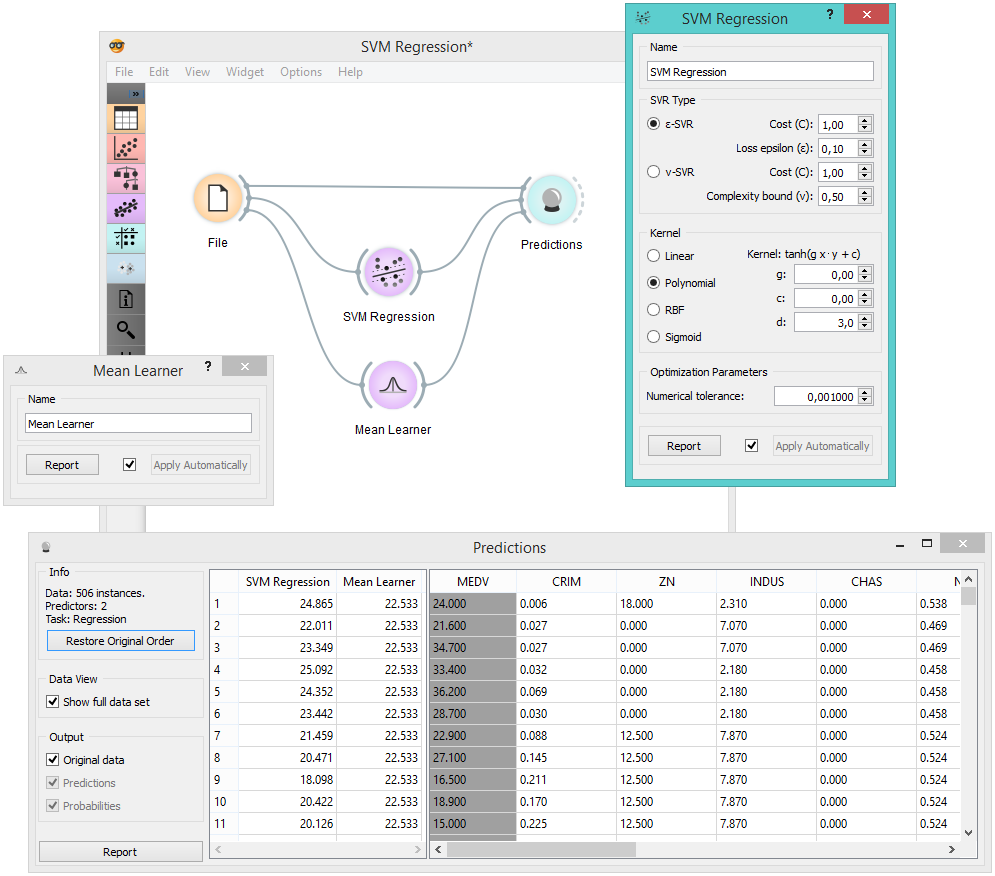
Example
Below, we use two regression models to compare predictions in the Predictions widget. We used the Housing data set.