Regression Tree

Regression Tree
Signals
Inputs:
Data
A data set
Preprocessor
Preprocessed data.
Outputs:
Learner
A regression tree learning algorithm with settings as specified in the dialog.
Predictor
Trained regressor.
Description
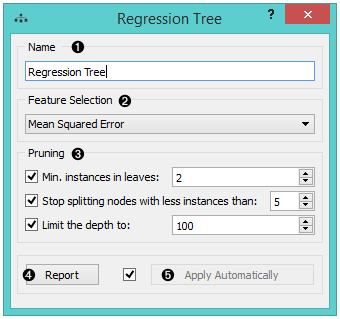
- The learner can be given a name under which it will appear in other widgets. The default name is “Regression Tree”.
- In Feature selection, there is just one option, namely Mean Squared Error, which measures the average of the squares of the errors or deviations (the difference between the estimator and what is estimated).
- Pruning criteria:
- Minimal instances in leaves; if checked, the algorithm will never construct a split which would put less than the specified number of training examples into any of the branches.
- Stop splitting nodes with less instances than forbids the algorithm to split the nodes with less than the given number of instances.
- Limit the depth of the regression tree.
- Produce a report.
- After changing the settings, you need to click Apply, which will put the new learner in the output and, if the training examples are given, construct a new regressor and output it as well.
Examples
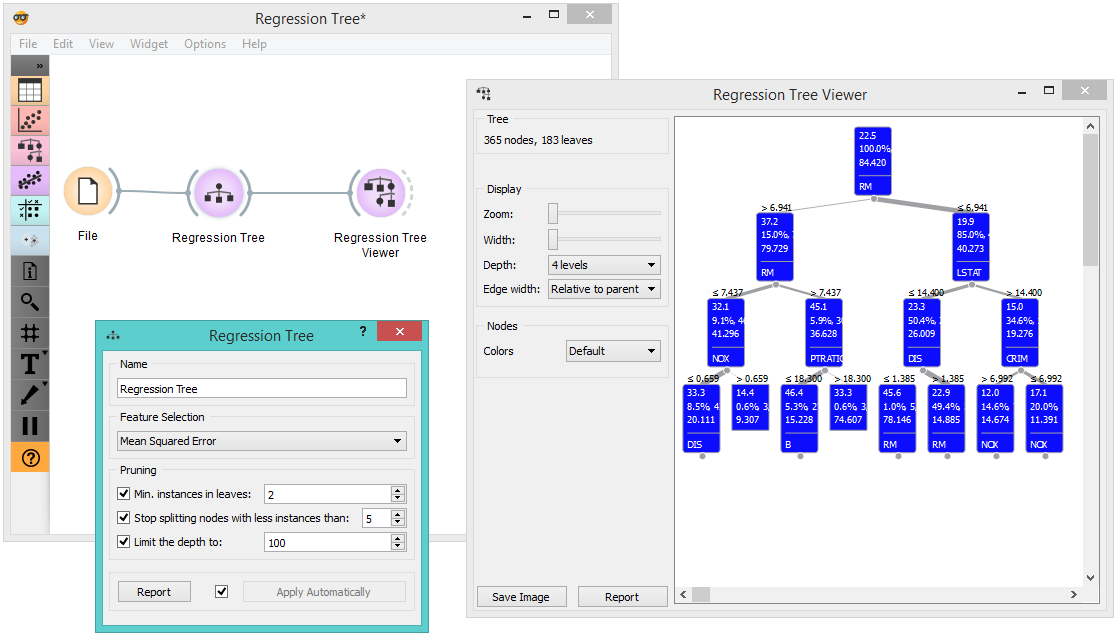
There are two typical uses for this widget. First, you may want to induce a model and check what it looks like. You do it with the workflow below. To learn more about it, see the documentation on Regression Tree Viewer.
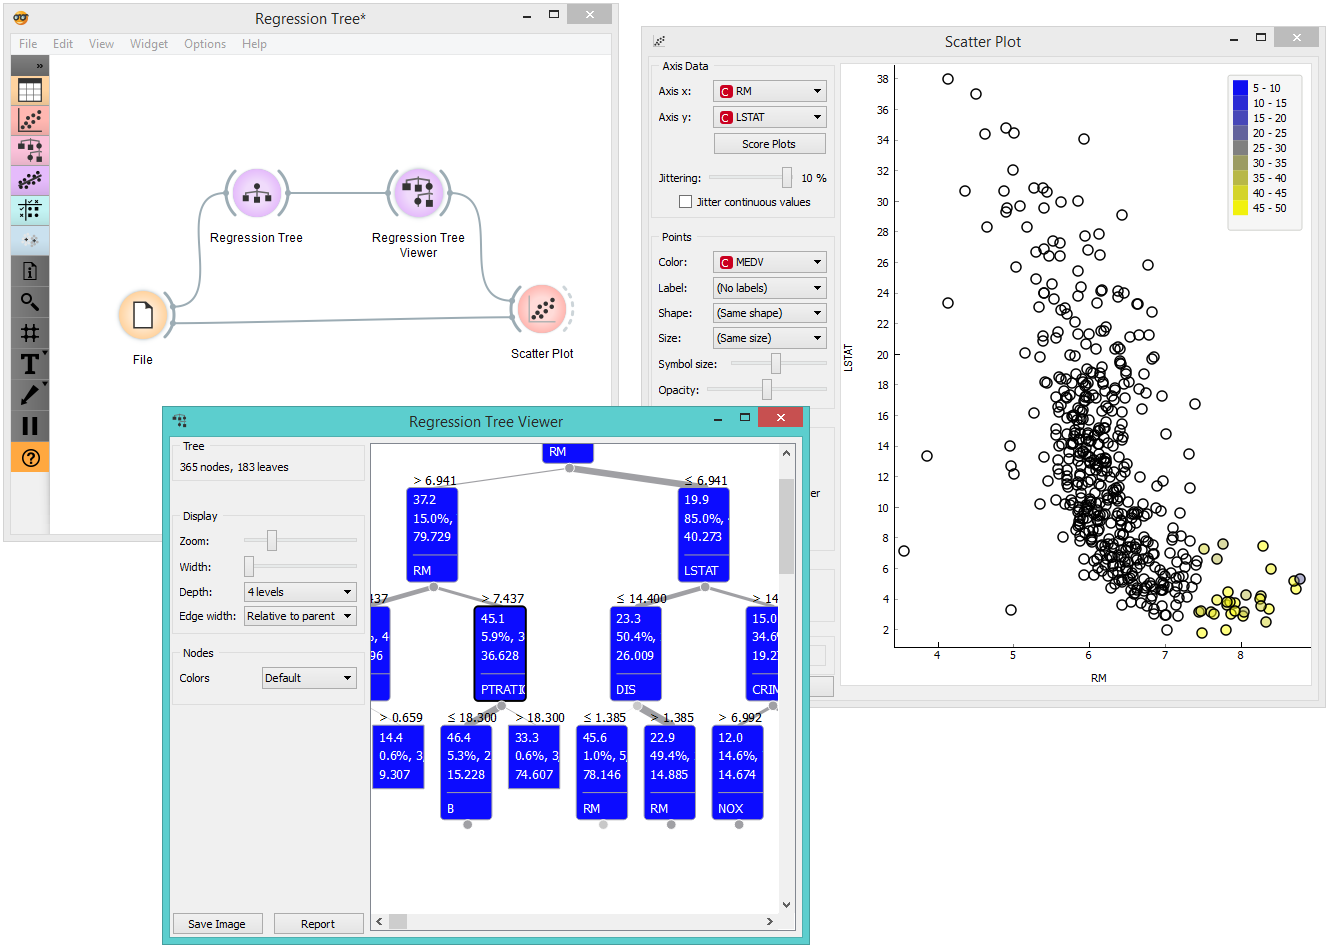
The second schema checks the accuracy of the algorithm. The selected tree node is presented in the Scatter Plot and we can see that the selected examples exhibit the same features.