Regression Tree Viewer

Visualization of a regression tree.
Description
This is a versatile widget with 2-D visualization of a regression tree. The user can select a node, instructing the widget to output the data associated with the node, thus enabling explorative data analysis.
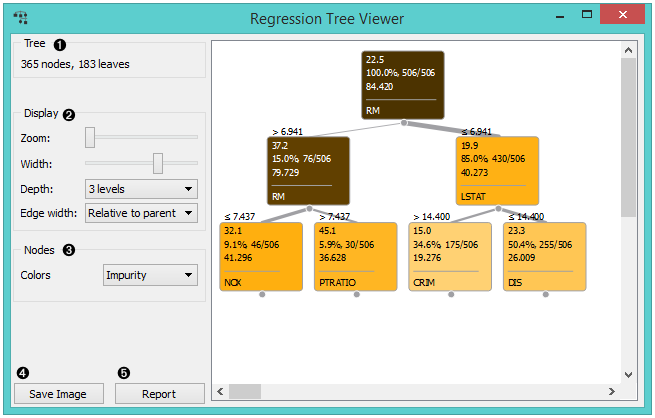
- Information on the input.
- Set the zoom and define the tree width. The nodes display tooltips when hovering over them.
- The edges between the nodes in the tree graph are drawn based on the selected
edge width.
- All the edges will be of equal width if Fixed is chosen.
- When Relative to root is selected, the width of the edge will correspond to the proportion of instances in the corresponding node with respect to all the instances in the training data. Under this selection, the edge will get thinner and thinner when traversing toward the bottom of the tree.
- Relative to parent makes the edge width correspond to the proportion of instances in the nodes with respect to the instances in their parent node.
- The nodes box defines the target class, which you can change based on the classes in the data. You can also use Set Colors and color the tree according to the number of instances in a node or impurity. You can also choose to keep the default coloring.
- Press Save Graph to save the regression tree graph as a file to your computer in a .svg or .png format.
- Regression tree.
Examples
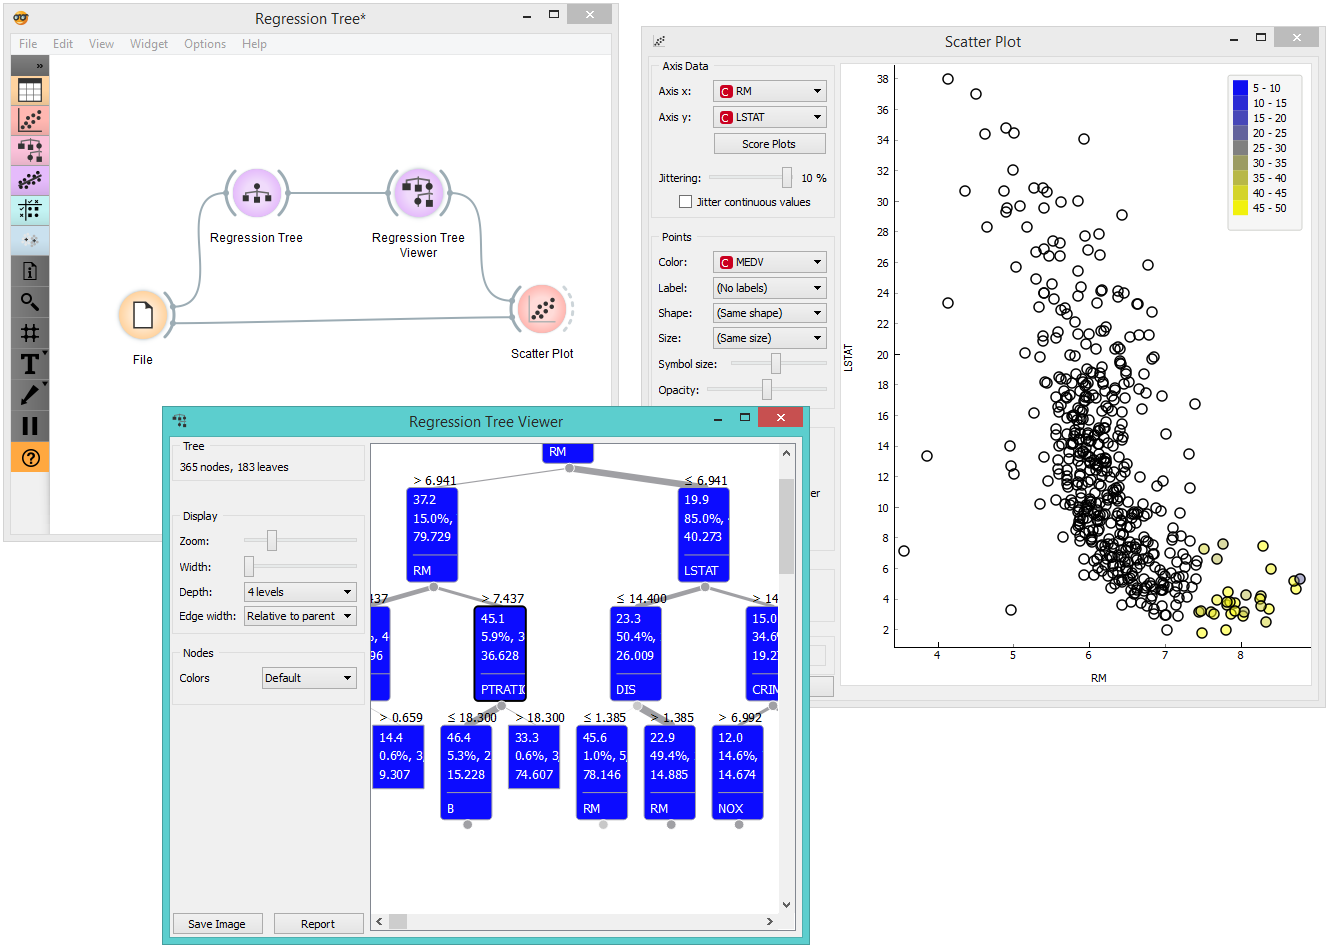
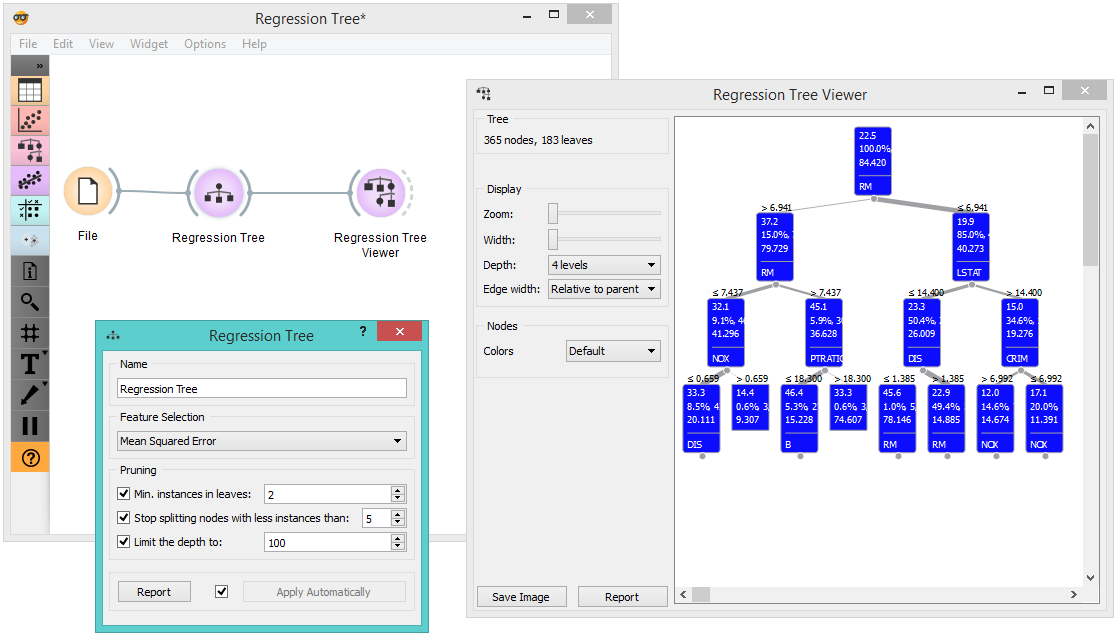
Below, is a simple schema, where we have read the data, constructed the regression tree and viewed it in our tree viewer. We loaded the Housing data set and limited the depth of the tree to only 4 levels because of the vastness of the data set. It is worth remembering that if both the viewer and Regression Tree are open, any run of the tree induction algorithm will immediately affect the visualization. You can thus use this combination to explore how parameters of the induction algorithm influence the structure of the resulting tree.
Clicking on any node will output the related data instances. This is explored in the Scatterplot. Make sure that the tree data is passed as a data subset; this can be done by connecting the Scatterplot to the File widget first, and connecting it to the Tree Viewer widget next.