Random Forest Regression

Random forest regression
Signals
Inputs:
- Data
Data set
- Preprocessor
Preprocessed data.
Outputs:
- Learner
Random forest learning algorithm with settings as specified in the dialog.
- Predictor
Trained regressor.
Description
Random forest is an ensemble learning method used for classification, regression and other tasks. It was first proposed by Tin Kam Ho and further developed by Leo Breiman and Adele Cutler. When given a data set, Random Forest builds a set of regression trees. Each tree is developed from a bootstrap sample from the training data. When developing individual trees, an arbitrary subset of attributes is drawn (hence the term “Random”) from which the best attribute for the split is selected.
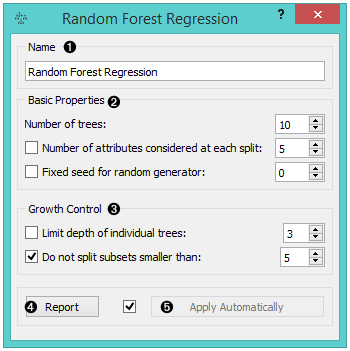
- Specify the name of the learner or predictor. The default name is Random Forest Regression.
- Specify how many regression trees will be included in the forest (Number of trees in the forest), and how many attributes will be arbitrarily drawn for consideration at each node. If the latter is not specified (option Number of attributes... left unchecked), this number is equal to the square root of the number of attributes in the data. You can also choose to control the random number generator (Fixed seed for random generator).
- Original Brieman’s proposal is to grow the trees without any pre-prunning, but since pre-pruning often works quite well and is faster, the user can set the depth to which the trees will be grown (Limit depth of individual trees). Another pre-pruning option is stop splitting nodes when the maximal depth is reached (Do not split subsets smaller than).
- Produce a report.
- Click Apply to communicate the changes to other widgets. Alternatively, tick Apply Automatically and changes will be communicated automatically.
Example
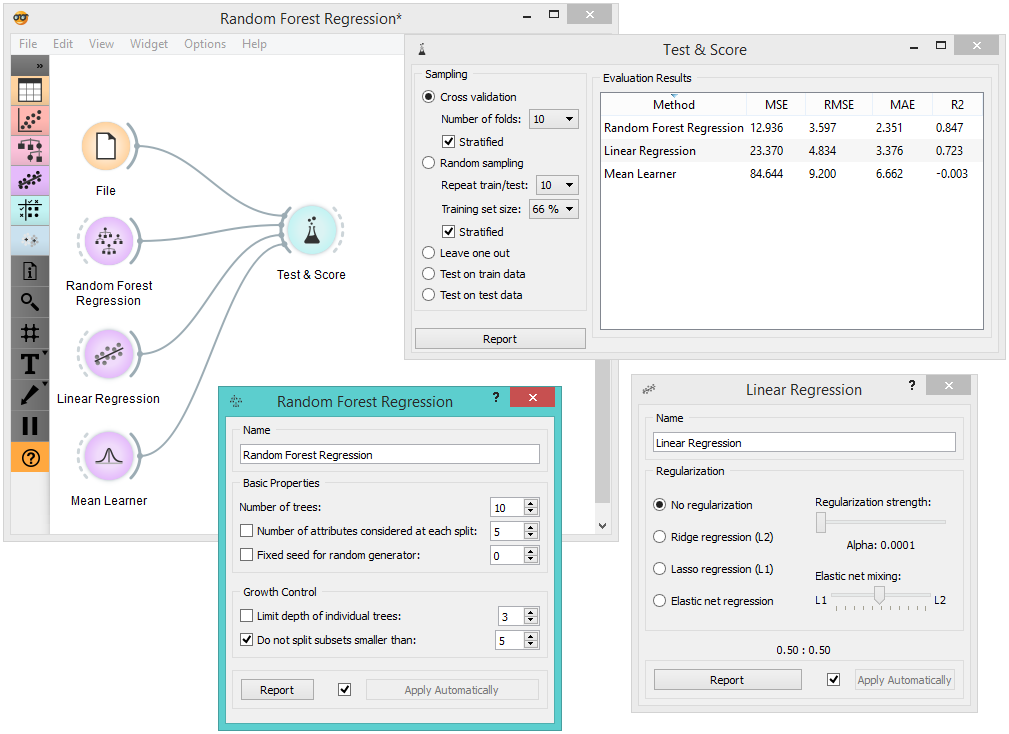
The example below compares different learnes, namely Random Forest Regression, Linear Regression and Mean Learner, in the Test&Score widget.
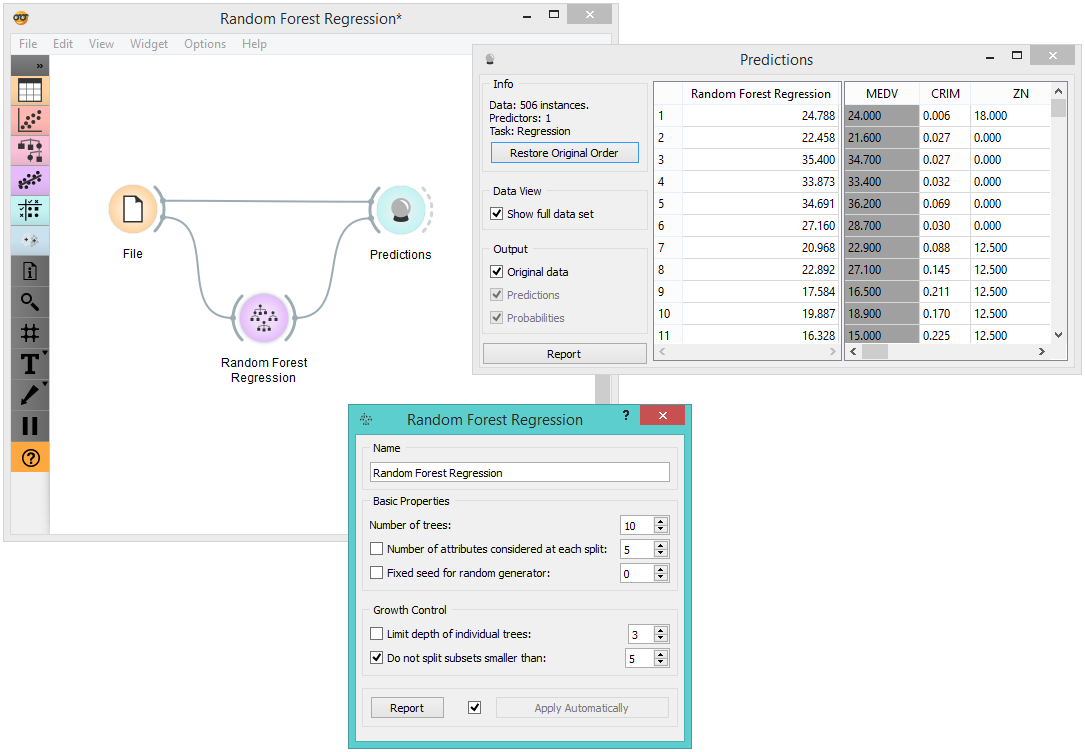
In order to demonstrate how to use the Predictor output, we used the Housing data set and connected the Random Forest Regression widget with the Predictions widget. The results are displayed in the appended data table.