Outliers

Simple outlier detection by comparing distances between instances.
Signals
Inputs:
Data
A data set
Distances
A distance matrix
Outputs:
Outliers
A data set containing instances scored as outliers
Inliers
A data set containing instances not scored as outliers
Description
The Outliers widget applies one of the two methods for outlier detection. Both methods apply classification to the data set, one with SVM (multiple kernels) and the other with elliptical envelope. One-class SVM with non-linear kernels (RBF) performs well with non-Gaussian distributions, while Covariance estimator works only for data with Gaussian distribution.
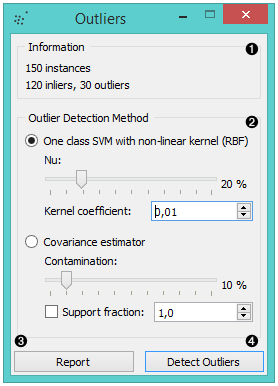
- Information on the input data, number of inliers and outliers based on the selected model.
- Select the Outlier detection method:
- One class SVM with non-linear kernel (RBF): classifies data as
similar or different from the core class
- Nu is a parameter for the upper bound on the fraction of training errors and a lower bound of the fraction of support vectors
- Kernel coefficient is a gamma parameter, which specifies how much influence a single data instance has
- Covariance estimator: fits ellipsis to central points with
Mahalanobis distance metric
- Contamination is the proportion of outliers in the data set
- Support fraction specifies the proportion of points included in the estimate
- One class SVM with non-linear kernel (RBF): classifies data as
similar or different from the core class
- Produce a report.
- Click Detect outliers to output the data.
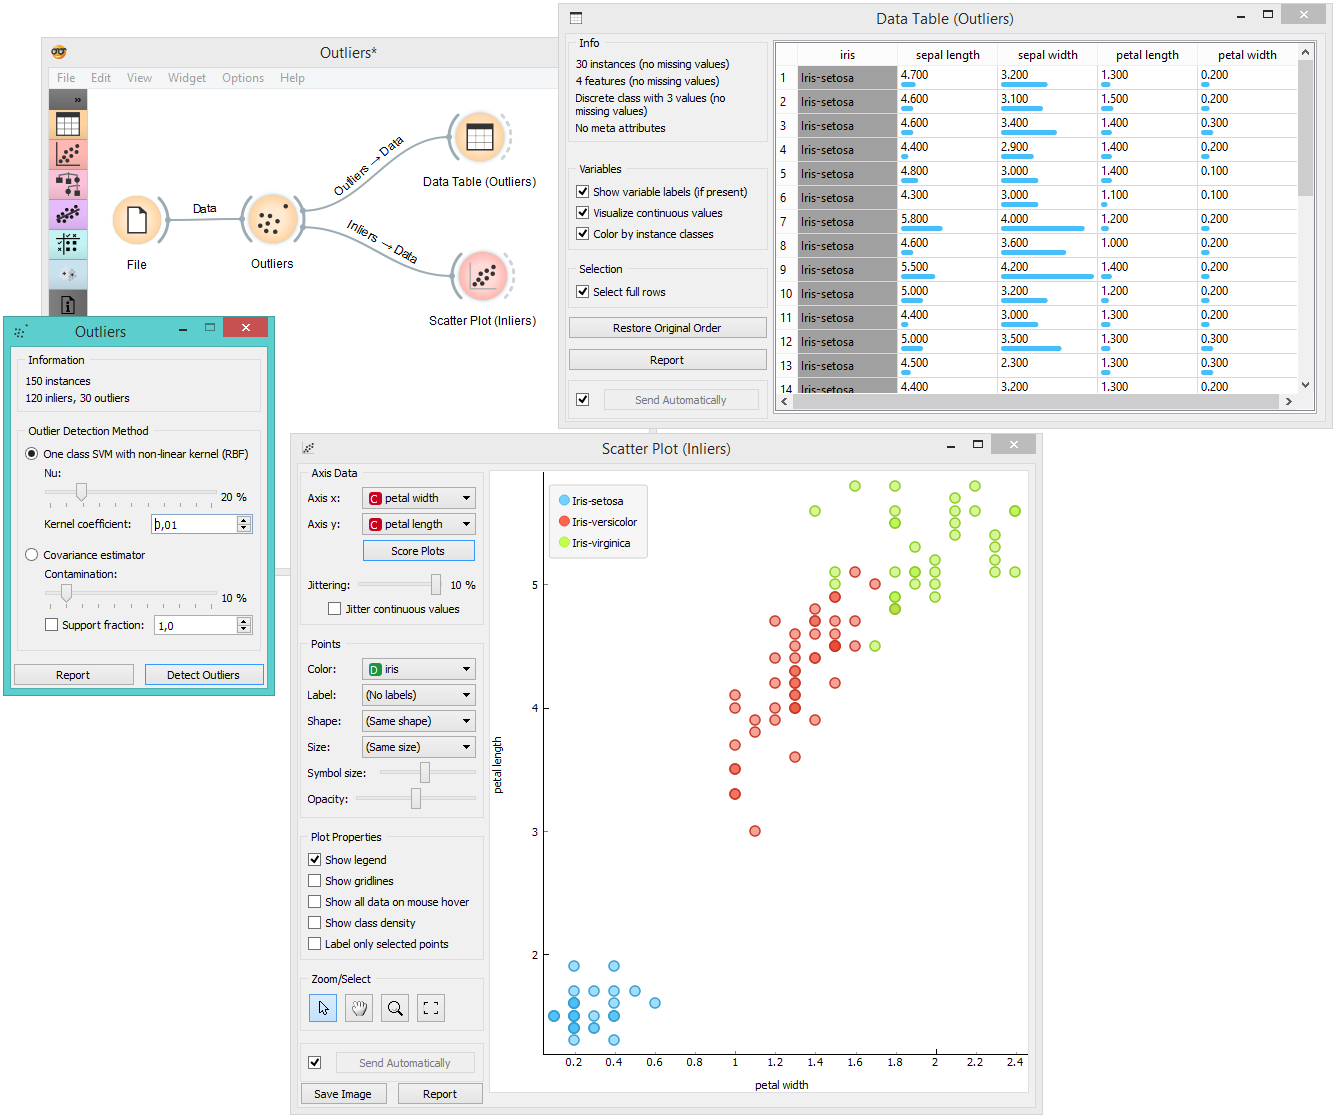
Example
Below, is a simple example of how to use this widget. We used the Iris data set to detect the outliers. We chose the one class SVM with non-linear kernel (RBF) method, with Nu set at 20% (less training errors, more support vectors). Then we observed the outliers in the Data Table widget, while we sent the inliers to the Scatter Plot.