Manifold Learning

Nonlinear dimensionality reduction.
Signals
Inputs:
Data
A data set
Outputs:
Transformed Data
A data set with new, reduced coordinates.
Description
Manifold Learning is a technique which finds a non-linear manifold within the higher-dimensional space. The widget then outputs new coordinates which correspond to a two-dimensional space. Such data can be later visualized with Scatter Plot or other visualization widgets.
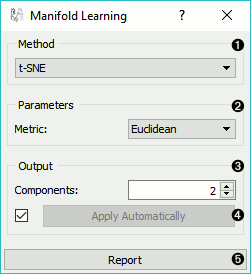
- Method for manifold learning:
- Set parameters for the method:
- t-SNE (distance measures):
- Euclidean distance
- Manhattan
- Chebyshev
- Jaccard
- Mahalanobis
- Cosine
- MDS (iterations and initialization):
- max interations: maximum number of optimization interations
- initialization: method for initialization of the algorithm (PCA or random)
- Isomap:
- number of neighbors
- Locally Linear Embedding:
- method:
- standard
- modified
- hessian eigenmap
- local
- number of neighbors
- max iterations
- Spectral Embedding:
- affinity:
- nearest neighbors
- RFB kernel
- Output: the number of reduced features (components).
- If Apply automatically is ticked, changes will be propagated automatically. Alternatively, click Apply.
- Produce a report.
Manifold Learning widget produces different embeddings for high-dimensional data.
... figure:: images/collage-manifold.png
From left to right, top to bottom: t-SNE, MDS, Isomap, Locally Linear Embedding and Spectral Embedding.
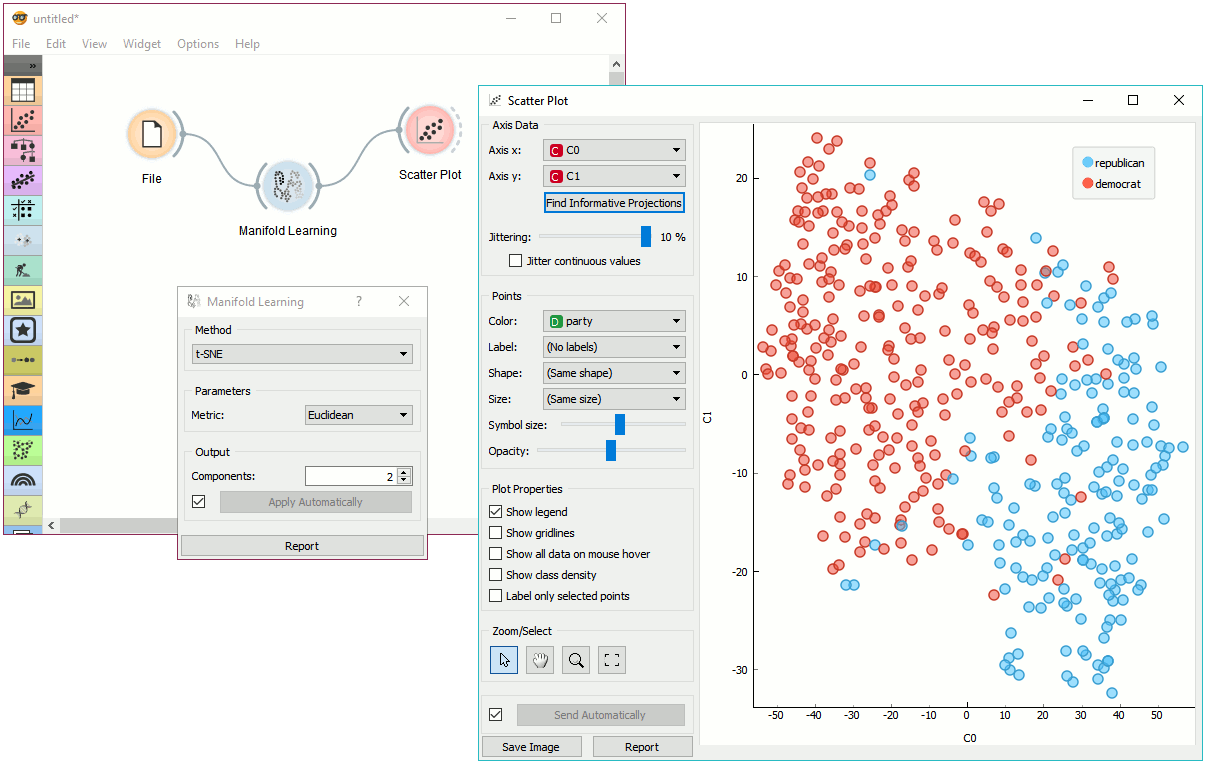
Example
Manifold Learning widget transforms high-dimensional data into a lower dimensional approximation. This makes it great for visualizing data sets with many features. We used voting.tab to map 16-dimensional data onto a 2D graph. Then we used Scatter Plot to plot the embeddings.