Distances

Computes distances between rows/columns in a data set.
Description
The Distances widget computes distances between rows or columns in a data set.
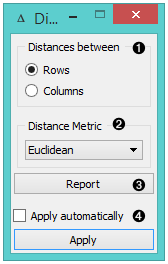
Choose whether to measure distances between rows or columns.
Choose the Distance Metric:
- Euclidean (“straight line”, distance between two points)
- Manhattan (the sum of absolute differences for all attributes)
- Cosine (the cosine of the angle between two vectors of an inner product space)
- Jaccard (the size of the intersection divided by the size of the union of the sample sets)
- Spearman (linear correlation between the rank of the values, remapped as a distance in a [0, 1] interval)
- Spearman absolute (linear correlation between the rank of the absolute values, remapped as a distance in a [0, 1] interval)
- Pearson (linear correlation between the values, remapped as a distance in a [0, 1] interval)
- Pearson absolute (linear correlation between the absolute values, remapped as a distance in a [0, 1] interval)
In case of missing values, the widget automatically imputes the average value of the row or the column.
Since the widget cannot compute distances between discrete and continuous attributes, it only uses continuous attributes and ignores the discrete ones. If you want to use discrete attributes, continuize them with the Continuize widget first.
Produce a report.
Tick Apply Automatically to automatically commit changes to other widgets. Alternatively, press ‘Apply‘.
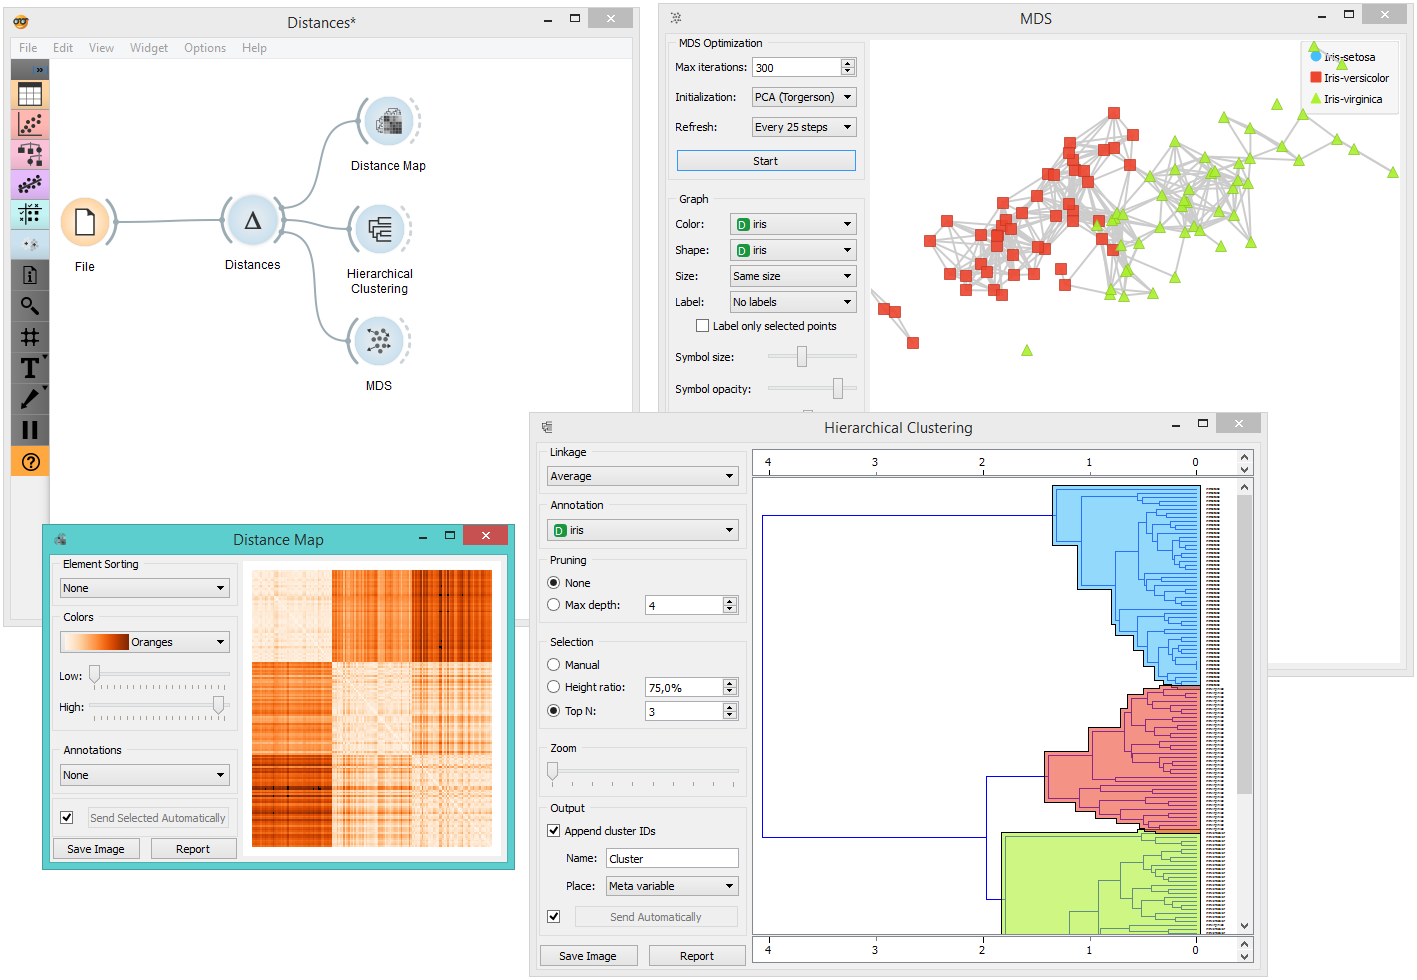
Example
This widget needs to be connected to another widget to display results, for instance to Distance Map to visualize distances, Hierarchical Clustering to cluster the attributes, or MDS to visualize the distances in a plane.