Continuize

Turns discrete attributes into continuous dummy variables.
Description
The Continuize widget receives a data set in the input and outputs the same data set in which the discrete attributes (including binary attributes) are replaced with continuous ones.
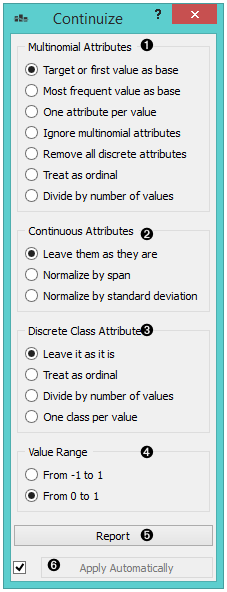
- Continuization methods, which define the treatment of multivalued discrete attributes. Say that we have a discrete attribute status with the values low, middle and high, listed in that order. Options for their transformation are:
- Target or First value as base: the attribute will be transformed into two continuous attributes, status=middle with values 0 or 1 signifying whether the original attribute had value middle on a particular example, and similarly, status=high. Hence, a three-valued attribute is transformed into two continuous attributes, corresponding to all except the first value of the attribute.
- Most frequent value as base: similar to the above, except that the data is analyzed and the most frequent value is used as a base. So, if most examples have the value middle, the two newly constructed continuous attributes will be status=low and status=high.
- One attribute per value: this would construct three continuous attributes out of a three-valued discrete one.
- Ignore multinominal attributes: removes the multinominal attributes from the data.
- Treat as ordinal: converts the attribute into a continuous attribute with values 0, 1, and 2.
- Divide by number of values: same as above, except that the values are normalized into range 0-1. So, our case would give values 0, 0.5 and 1.
- Define the treatment of continuous attributes. You will usually prefer the Leave them as they are option. The alternative is Normalize by span, which will subtract the lowest value found in the data and divide by the span, so all values will fit into [0, 1]. Finally, Normalize by standard deviation subtracts the average and divides by the deviation.
- Define the treatment of class attributes. Besides leaving it as it is, there are also a couple of options available for multinominal attributes, except for those options which split the attribute into more than one attribute - this obviously cannot be supported since you cannot have more than one class attribute.
- With value range, you can define the values of new attributes. In the above text, we supposed the range from 0 to 1. You can change it to from -1 to 1.
- Produce a report.
- If Apply automatically is ticked, changes are committed automatically. Otherwise, you have to press Apply after each change.
Examples
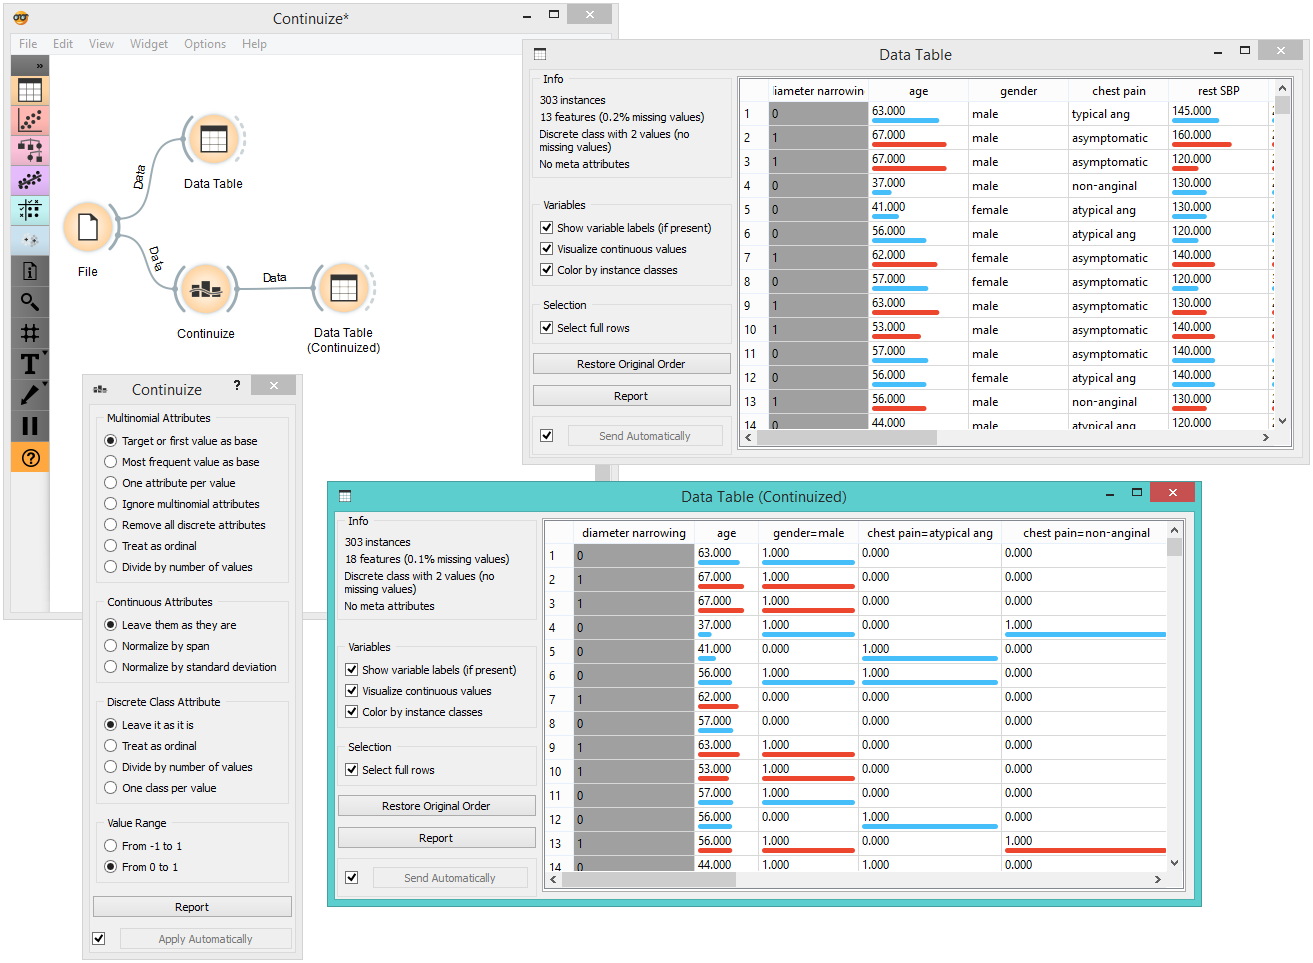
First, let’s see what is the output of the Continuize widget. We feed the original data (the Heart disease data set) into the Data Table and see how they look like. Then we continuize the discrete values and observe them in another Data Table.
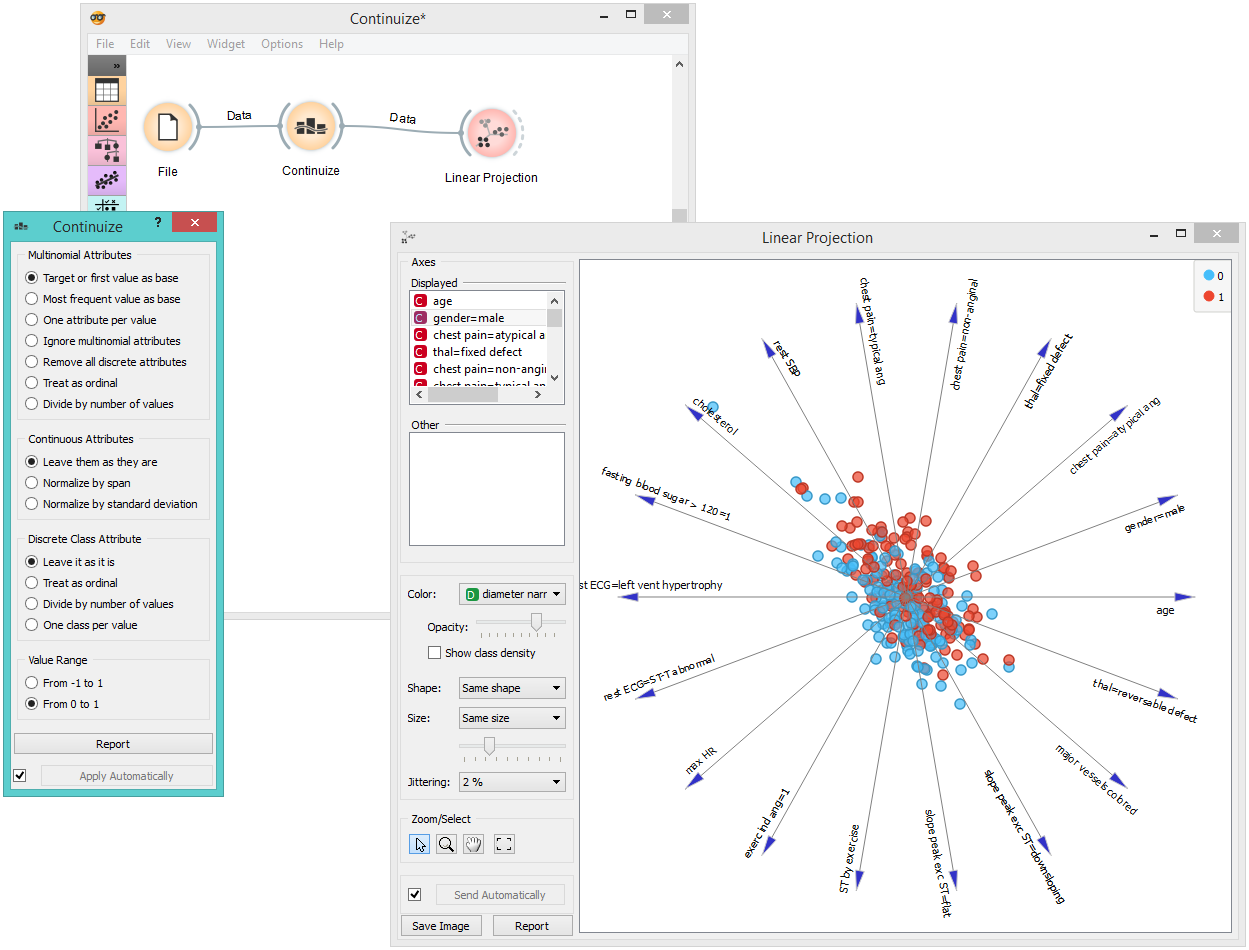
In the second example, we show a typical use of this widget - in order to properly plot the linear projection of the data, discrete attributes need to be converted to continuous ones and that is why we put the data through the Continuize widget before drawing it. The attribute “chest pain” originally had four values and was transformed into three continuous attributes; similar happened to gender, which was transformed into a single attribute “gender=female”.