Data Sampler

Selects a subset of data instances from an input data set.
Signals
Inputs:
Data
Input data set to be sampled.
Outputs:
Data Sample
A set of sampled data instances.
Remaining Data
All other data instances from the input data set, which are not included in the sample.
Description
The Data Sampler widget implements several means of sampling data from an input channel. It outputs a sampled and a complementary data set (with instances from the input set that are not included in the sampled data set). The output is processed after the input data set is provided and Sample Data is pressed.
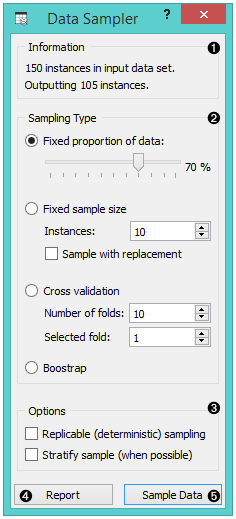
- Information on the input and output data set
- The desired sampling method:
- Fixed proportion of data returns a selected percentage of the entire data (e.g. 70% of all the data)
- Fixed sample size returns a selected number of data instances with a chance to set Sample with replacement, which always samples from the entire data set (does not subtract instances already in the subset)
- Cross Validation partitions data instances into complementary subsets, where you can select the number of folds (subsets) and which fold you want to use as a sample.
- Replicable sampling maintains sampling patterns that can be carried across users, while stratification mimics the composition of the input data set.
- Produce a report.
- Press Sample data to output the data sample.
Examples
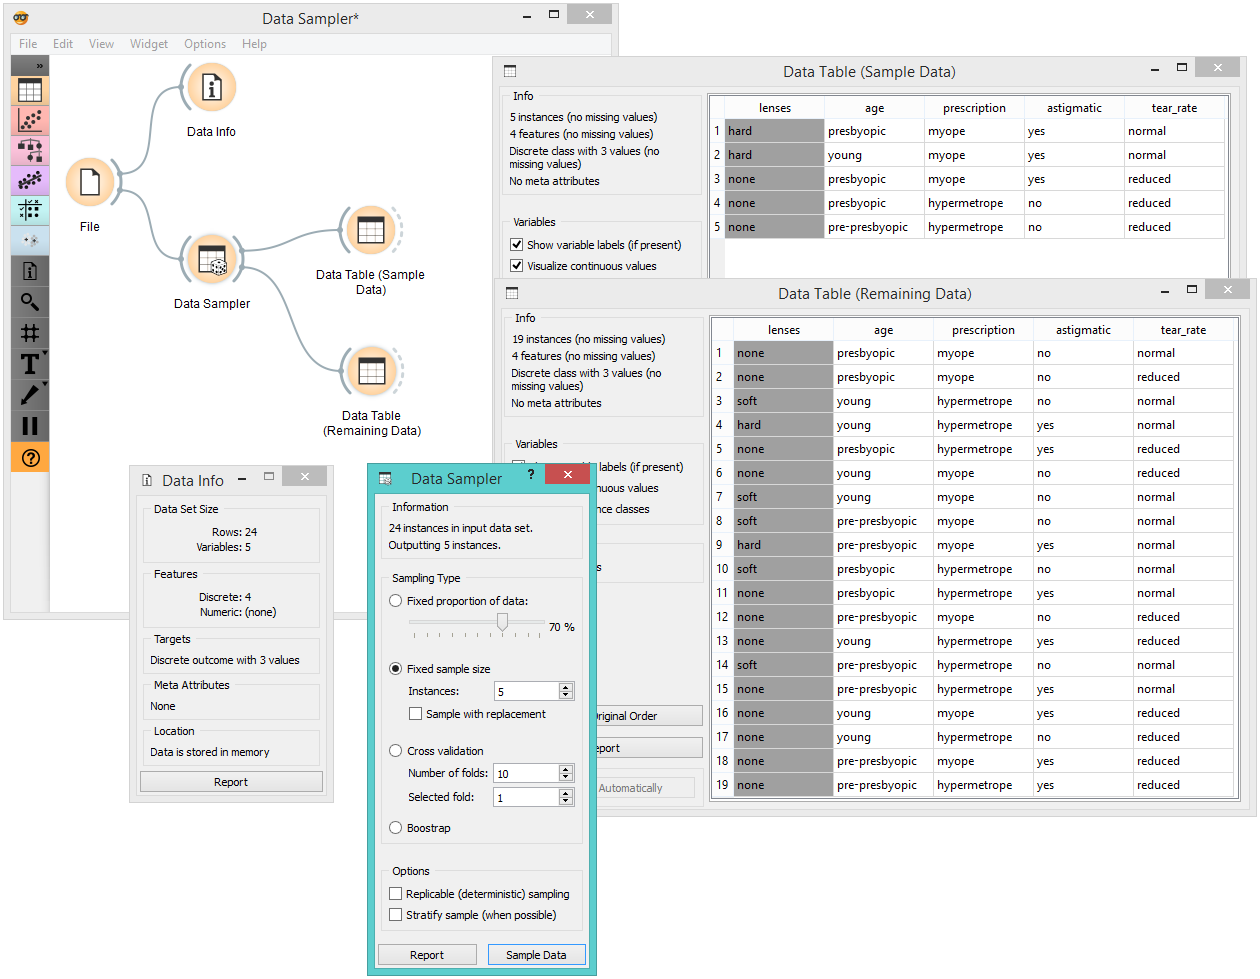
First, let’s see how the Data Sampler works. Let’s look at the information on the original data set in the Data Info widget. We see there are 24 instances in the data (we used lenses.tab). We sampled the data with the Data Sampler widget and we chose to go with a fixed sample size of 5 instances for simplicity. We can observe the sampled data in the Data Table widget. The second Data Table shows the remaining 19 instances that weren’t in the sample.
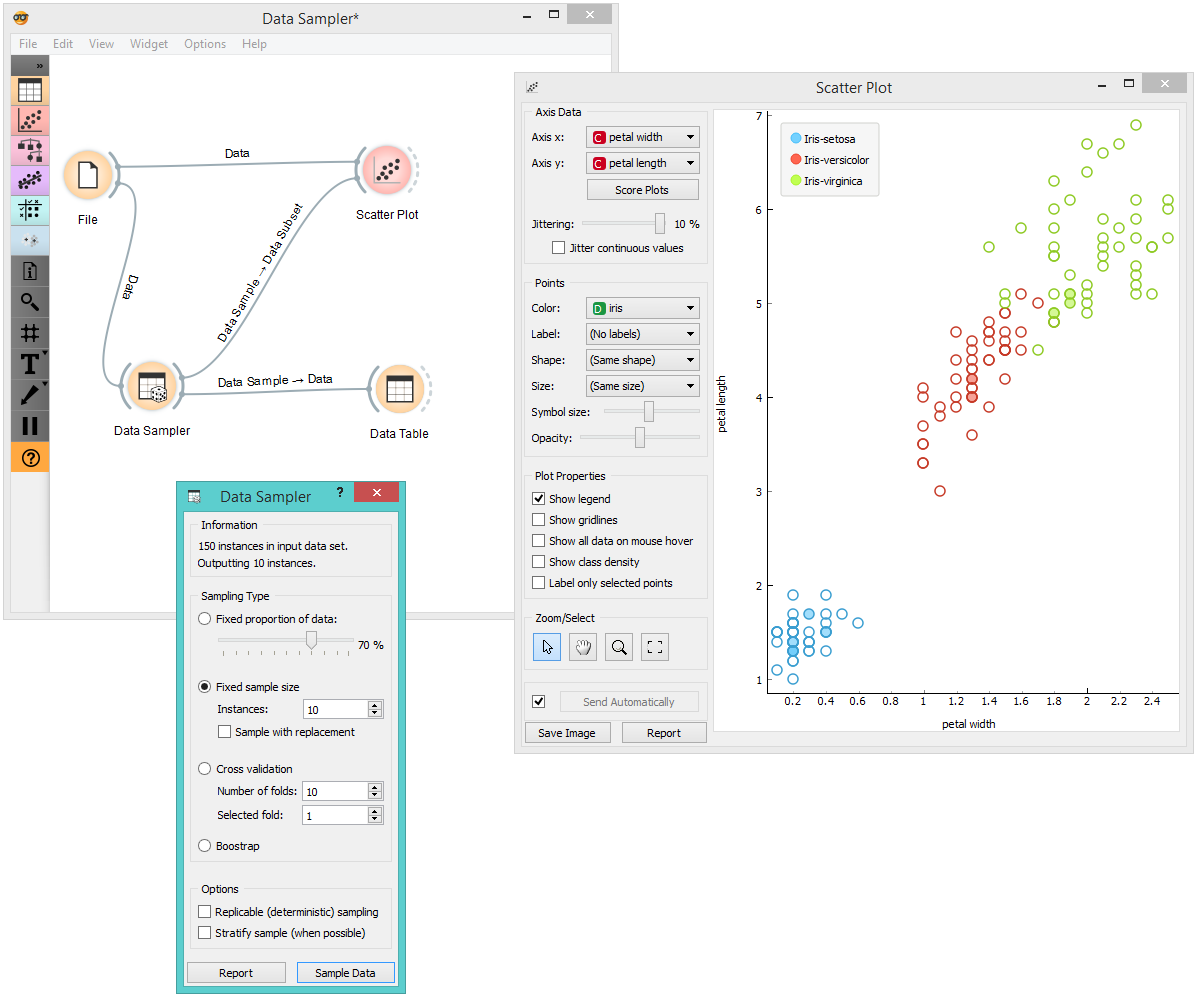
In the workflow below, we have sampled 10 data instances from the Iris data set and sent the original data and the sample to Scatter Plot widget for exploratory data analysis. The sampled data instances are plotted with filled circles, while the original data set is represented with empty circles.