SVM

Support vector machine learning algorithm.
Signals
Inputs:
Data
A data set.
Preprocessor
Preprocessed data.
Outputs:
Learner
A support vector machine learning algorithm with settings as specified in the dialog.
Classifier
A trained SVM classifier
Support Vectors
A subset of data instances from the training set that were used as support vectors in the trained classifier
Description
Support vector machine (SVM) is a classification technique that separates the attribute space with a hyperplane, thus maximizing the margin between the instances of different classes. The technique often yields supreme predictive performance results. Orange embeds a popular implementation of SVM from the LIBSVM package. This widget is its graphical user interface.
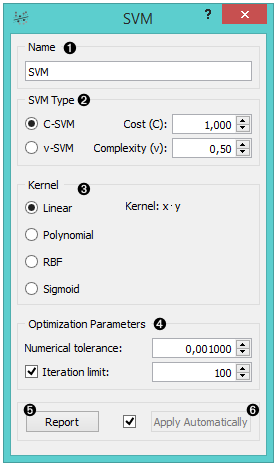
- The learner can be given a name under which it will appear in other widgets. The default name is “SVM”.
- Classification type with test error settings. C-SVM and v-SVM are based on different minimization of the error function. On the right side, you can set test error bounds, Cost for C-SVM and Complexity bound for v-SVM.
- The next block of options deals with kernel, a function that
transforms attribute space to a new feature space to fit the
maximum-margin hyperplane, thus allowing the algorithm to create
non-linear classifiers with
Polynomial,
RBF and
Sigmoid
kernels. Functions that specify the kernel are presented besides
their names, and the constants involved are:
- g for the gamma constant in kernel function (the recommended value is 1/k, where k is the number of the attributes, but since there may be no training set given to the widget the default is 0 and the user has to set this option manually),
- c for the constant c0 in the kernel function (default 0), and
- d for the degree of the kernel (default 3).
- Set permitted deviation from the expected value in Numerical Tolerance. Tick the box next to Iteration Limit to set the maximum number of iterations permitted.
- Produce a report.
- Click Apply to commit changes. If you tick the box on the left side of the Apply button, changes will be communicated automatically.
Examples
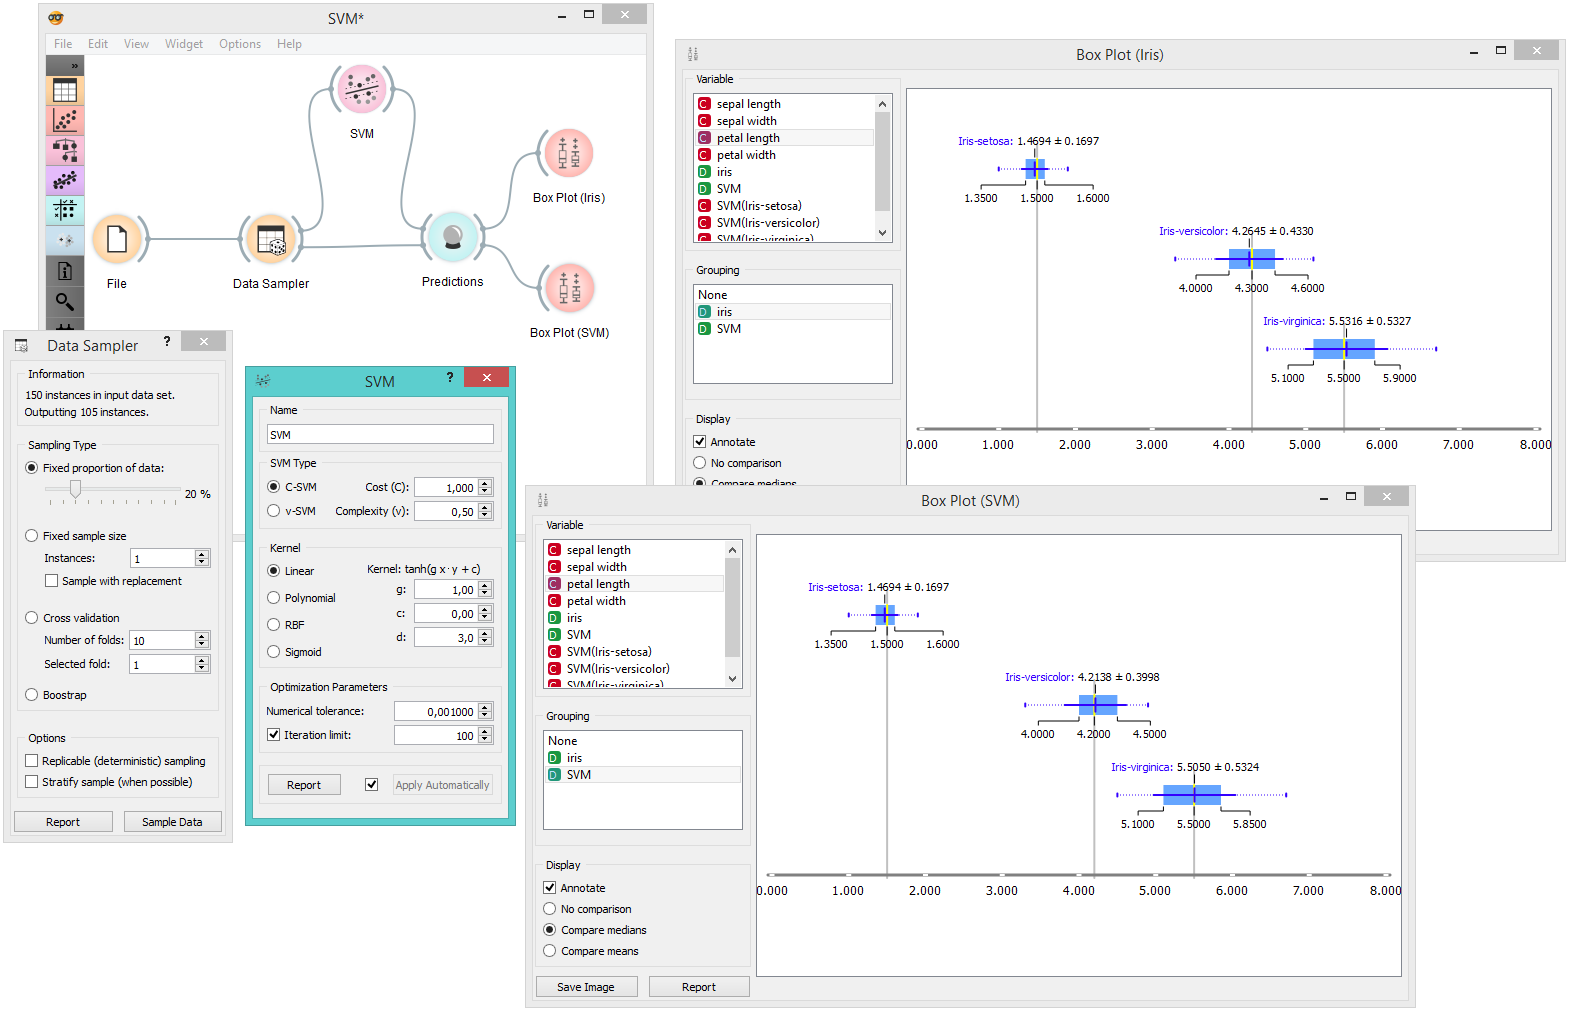
There are two typical uses for this widget, one where the widget is a classifier and the other where it constructs an object for learning. For the first one, we have split our data set into two data subsets (Sample and Remaining Examples). The sample was sent to SVM which produced a Classifier, which was then used in Predictions widget to classify the data in Remaning Examples. A similar schema can be used if the data is already in two separate files; in this case, two File widgets would be used instead of the File - Data Sampler combination.
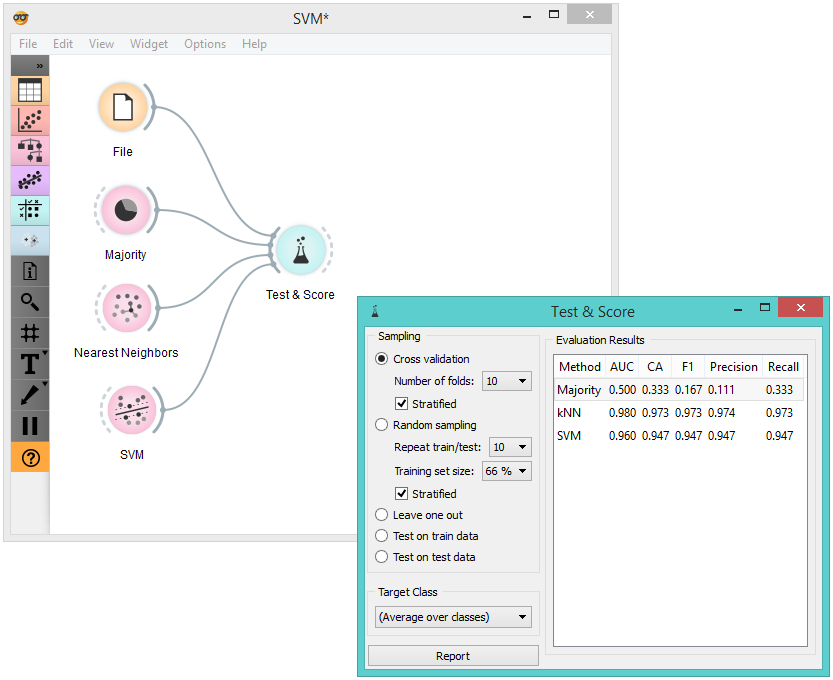
The second schema shows how to use the SVM widget to construct a learner and compare it in cross-validation with Majority and k-Nearest Neighbours learners.
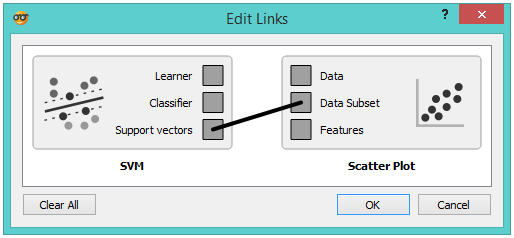
The following schema observes a set of support vectors in a Scatterplot visualization.
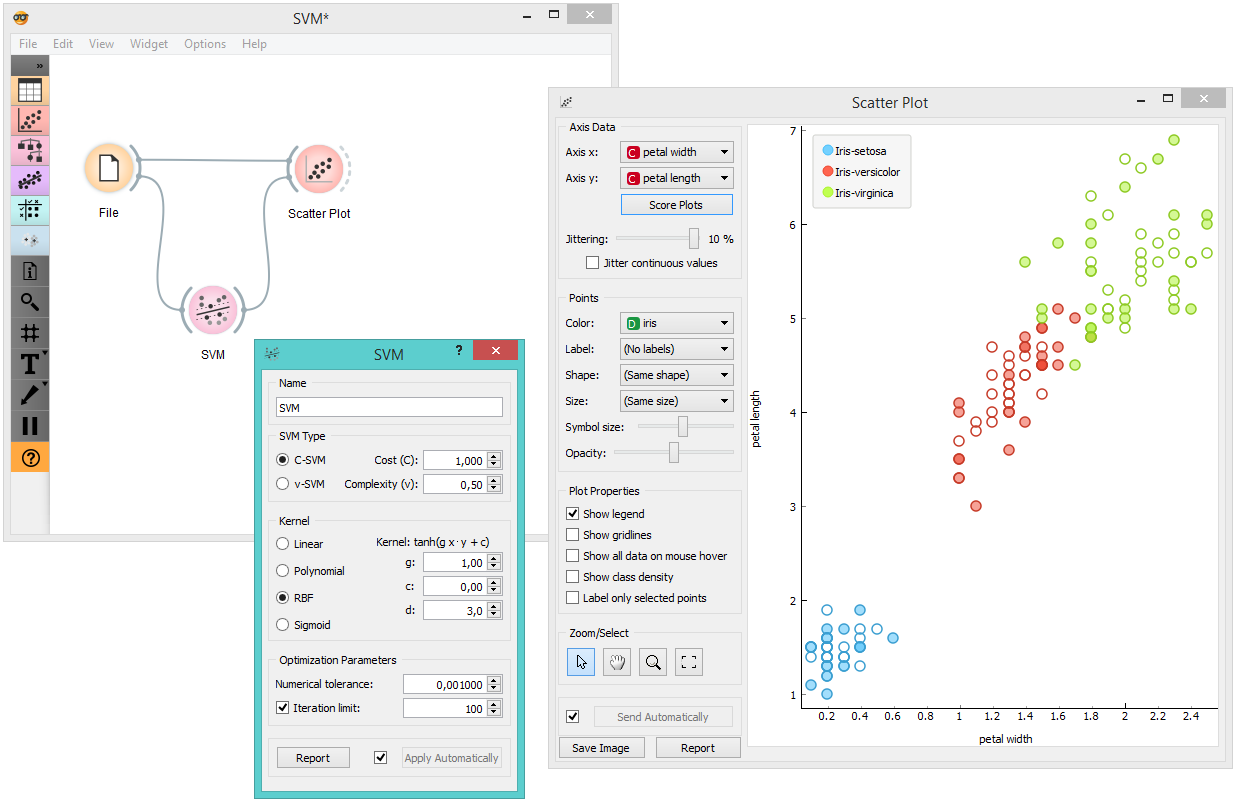
For the above schema to work correctly, the channel between SVM and Scatterplot widget has to be set appropriately. Set the channel between these two widgets by double-clicking on the connection between the widgets and use the settings as displayed in the dialog below.